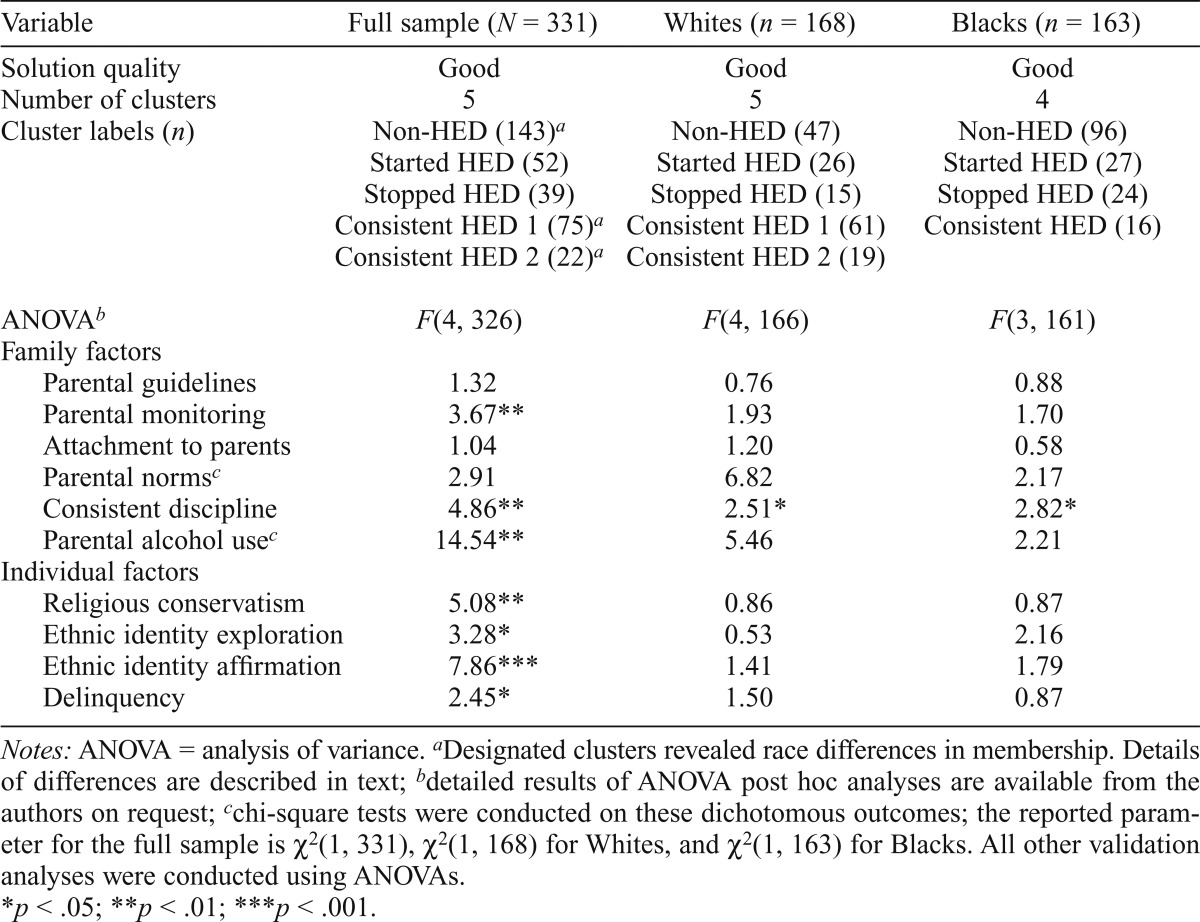
Table 3.
Cluster analyses based on heavy episodic drinking (HED) and alcohol problems at ages 20 and 22

| Variable | Full sample (N = 331) | Whites (n = 168) | Blacks (n = 163) |
| Solution quality | Good | Good | Good |
| Number of clusters | 5 | 5 | 4 |
| Cluster labels (n) | Non-HED (143)a | Non-HED (47) | Non-HED (96) |
| Started HED (52) | Started HED (26) | Started HED (27) | |
| Stopped HED (39) | Stopped HED (15) | Stopped HED (24) | |
| Consistent HED 1 (75)a | Consistent HED 1 (61) | Consistent HED (16) | |
| Consistent HED 2 (22)a | Consistent HED 2 (19) | ||
| ANOVAb | F(4, 326) | F(4, 166) | F(3, 161) |
| Family factors | |||
| Parental guidelines | 1.32 | 0.76 | 0.88 |
| Parental monitoring | 3.67** | 1.93 | 1.70 |
| Attachment to parents | 1.04 | 1.20 | 0.58 |
| Parental normsc | 2.91 | 6.82 | 2.17 |
| Consistent discipline | 4.86** | 2.51* | 2.82* |
| Parental alcohol usec | 14.54** | 5.46 | 2.21 |
| Individual factors | |||
| Religious conservatism | 5.08** | 0.86 | 0.87 |
| Ethnic identity exploration | 3.28* | 0.53 | 2.16 |
| Ethnic identity affirmation | 7.86*** | 1.41 | 1.79 |
| Delinquency | 2.45* | 1.50 | 0.87 |
Notes: ANOVA = analysis of variance.
Designated clusters revealed race differences in membership. Details of differences are described in text;
detailed results of ANOVA post hoc analyses are available from the authors on request;
chi-square tests were conducted on these dichotomous outcomes; the reported parameter for the full sample is χ2(l, 331), χ2(l, 168) for Whites, and χ2(1, 163) for Blacks. All other validation analyses were conducted using ANOVAs.
p < .05;
p < .01;
p < .001.
