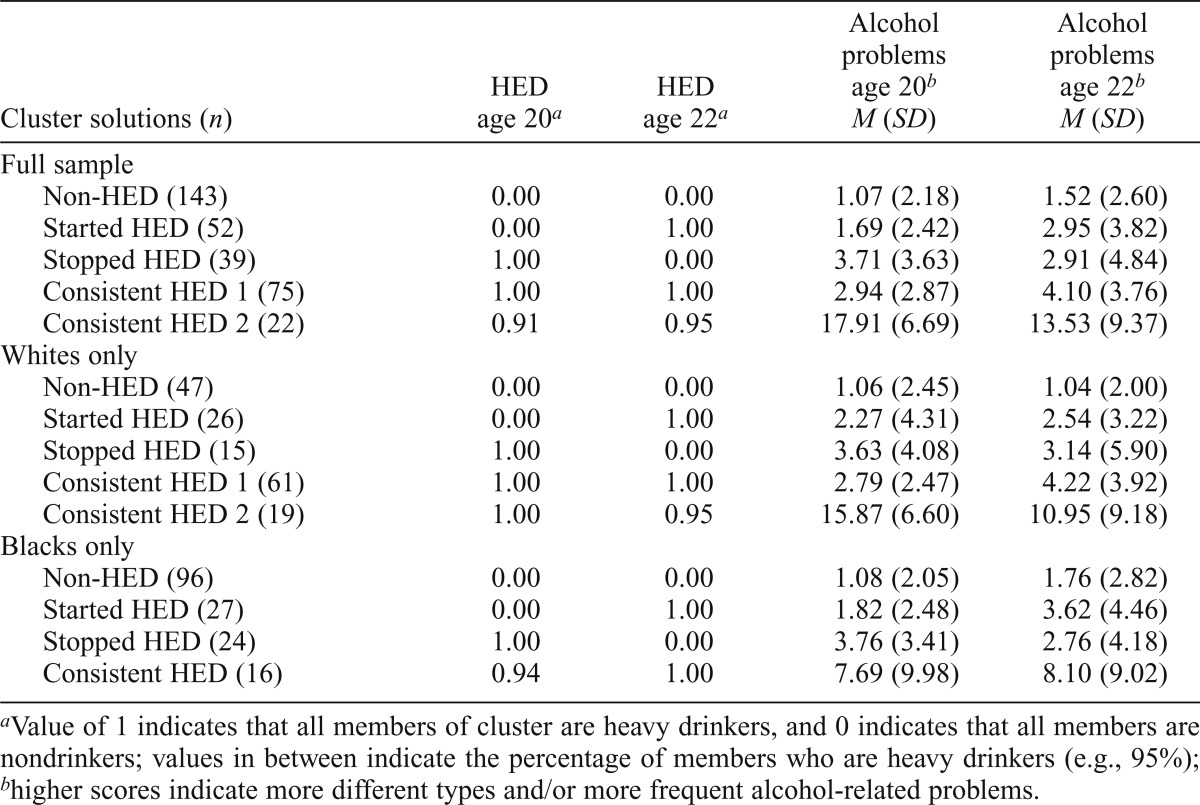
Table 4.
Mean values of clusters from analyses with heavy episodic drinking (HED) and alcohol problems

| Cluster solutions (n) | HED age 20a | HED age 22a | Alcohol problems age 20b M (SD) | Alcohol problems age 22b M (SD) |
| Full sample | ||||
| Non-HED (143) | 0.00 | 0.00 | 1.07 (2.18) | 1.52 (2.60) |
| Started HED (52) | 0.00 | 1.00 | 1.69 (2.42) | 2.95 (3.82) |
| Stopped HED (39) | 1.00 | 0.00 | 3.71 (3.63) | 2.91 (4.84) |
| Consistent HED 1 (75) | 1.00 | 1.00 | 2.94 (2.87) | 4.10 (3.76) |
| Consistent HED 2 (22) | 0.91 | 0.95 | 17.91 (6.69) | 13.53 (9.37) |
| Whites only | ||||
| Non-HED (47) | 0.00 | 0.00 | 1.06 (2.45) | 1.04 (2.00) |
| Started HED (26) | 0.00 | 1.00 | 2.27 (4.31) | 2.54 (3.22) |
| Stopped HED (15) | 1.00 | 0.00 | 3.63 (4.08) | 3.14 (5.90) |
| Consistent HED 1 (61) | 1.00 | 1.00 | 2.79 (2.47) | 4.22 (3.92) |
| Consistent HED 2 (19) | 1.00 | 0.95 | 15.87 (6.60) | 10.95 (9.18) |
| Blacks only | ||||
| Non-HED (96) | 0.00 | 0.00 | 1.08 (2.05) | 1.76 (2.82) |
| Started HED (27) | 0.00 | 1.00 | 1.82 (2.48) | 3.62 (4.46) |
| Stopped HED (24) | 1.00 | 0.00 | 3.76 (3.41) | 2.76 (4.18) |
| Consistent HED (16) | 0.94 | 1.00 | 7.69 (9.98) | 8.10 (9.02) |
Value of 1 indicates that all members of cluster are heavy drinkers, and 0 indicates that all members are nondrinkers; values in between indicate the percentage of members who are heavy drinkers (e.g., 95%);
higher scores indicate more different types and/or more frequent alcohol-related problems.
