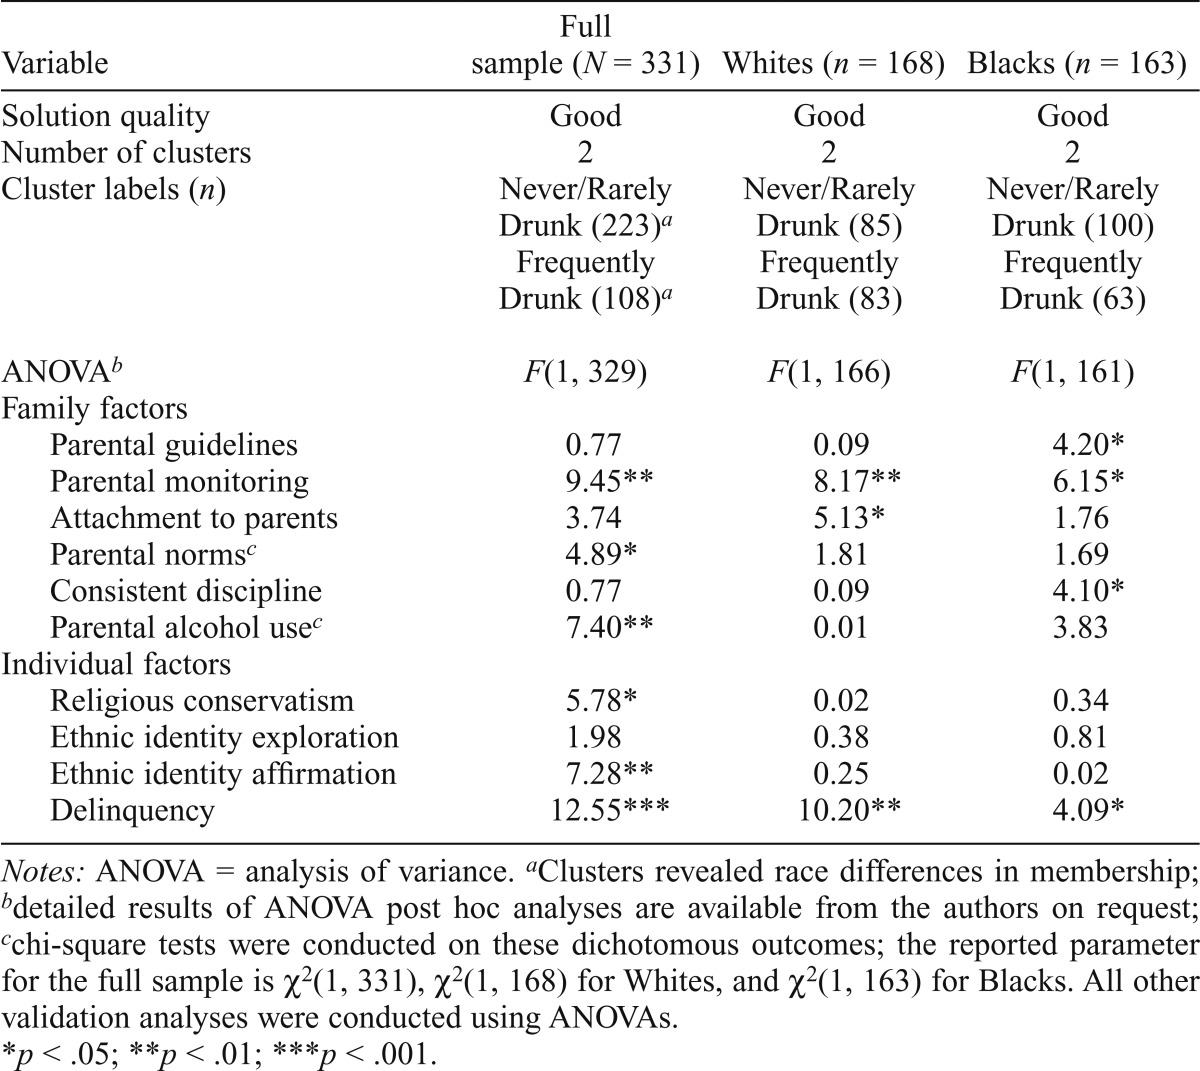
Table 5.
Cluster analyses based on drunkenness and alcohol problems at ages 20 and 22

| Variable | Full sample (N = 331) | Whites (n = 168) | Blacks (n = 163) |
| Solution quality | Good | Good | Good |
| Number of clusters | 2 | 2 | 2 |
| Cluster labels (n) | Never/Rarely Drunk (223)a | Never/Rarely Drunk (85) | Never/Rarely Drunk (100) |
| Frequently Drunk (108)a | Frequently Drunk (83) | Frequently Drunk (63) | |
| ANOVAb | F(1, 329) | F(1, 166) | F(1, 161) |
| Family factors | |||
| Parental guidelines | 0.77 | 0.09 | 4.20* |
| Parental monitoring | 9.45** | 8.17** | 6.15* |
| Attachment to parents | 3.74 | 5.13* | 1.76 |
| Parental normsc | 4.89* | 1.81 | 1.69 |
| Consistent discipline | 0.77 | 0.09 | 4.10* |
| Parental alcohol usec | 7.40** | 0.01 | 3.83 |
| Individual factors | |||
| Religious conservatism | 5.78* | 0.02 | 0.34 |
| Ethnic identity exploration | 1.98 | 0.38 | 0.81 |
| Ethnic identity affirmation | 7.28** | 0.25 | 0.02 |
| Delinquency | 12.55*** | 10.20** | 4.09* |
Notes: ANOVA = analysis of variance.
Clusters revealed race differences in membership;
detailed results of ANOVA post hoc analyses are available from the authors on request;
chi-square tests were conducted on these dichotomous outcomes; the reported parameter for the full sample is χ2(1, 331), χ2(1, 168) for Whites, and χ2(1, 163) for Blacks. All other validation analyses were conducted using ANOVAs.
p < .05;
p < .01;
p < .001.
