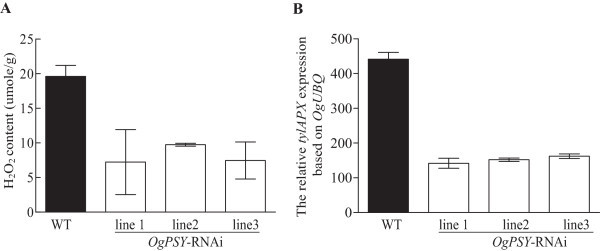
Figure 10.

H 2 O 2 levels and relative transcript level of tylAPX in wild-type and OgPSY -RNAi transgenic Oncidium . (A) H2O2 levels; (B) Transcript levels of tylAPX in wild type and OgPSY RNAi transgenic plants. Gene transcript levels were measured by RT-qPCR. Transcript levels were calculated and normalized with respect to ubiquitin mRNA. The experiment was repeated three times.
