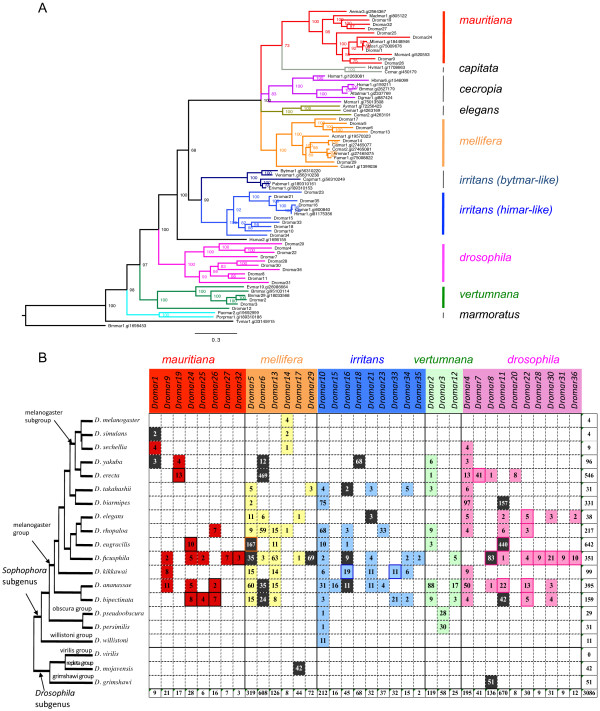
Figure 1.

mariner lineages identified in this study. (A) Phylogeny of mariner-like transposases generated by a Bayesian analysis using the WAG + G amino acid substitution model. Posterior probability of each node is indicated. Clade colors denote the different subfamilies of MLEs (indicated to the right of the tree). The NCBI accession numbers of the transposases found in the database are indicated after the element names. (B) Distribution of MLE lineages in Drosophila genomes, indicating the number of independent copies, not truncated by assembly. Subfamilies are colored as in A. Dark colors indicate lineages with potentially coding copies. Framed boxes indicate lineages with MITEs.
