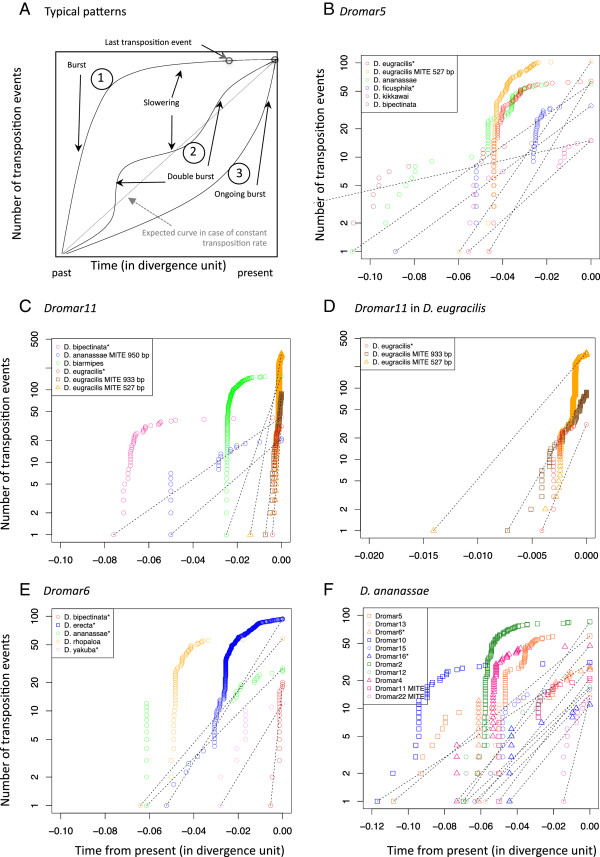
Figure 6.

Dynamics analysis of different lineages in different species. (A) Interpretation of curve shape in theoretical LTT (Lineage-Through-Time) plot (cumulative number of transposition events over time, measured in genetic divergence units). (B) LTT plot of Dromar5 in 5 species. The dotted lines represent the theoretical curves assuming a constant transposition rate per copy over time (exponential transposition). (C) Same analysis as in B for Dromar11. (D) - Magnification of C for the three recent D. eugracilis Dromar11 sublineages. (E) Same analysis as in B for Dromar6. (F) LTT plot of different lineages in D. ananassae. Colors reflect the subfamily of each lineage following the color code in Figure 1.
