Figure 5.

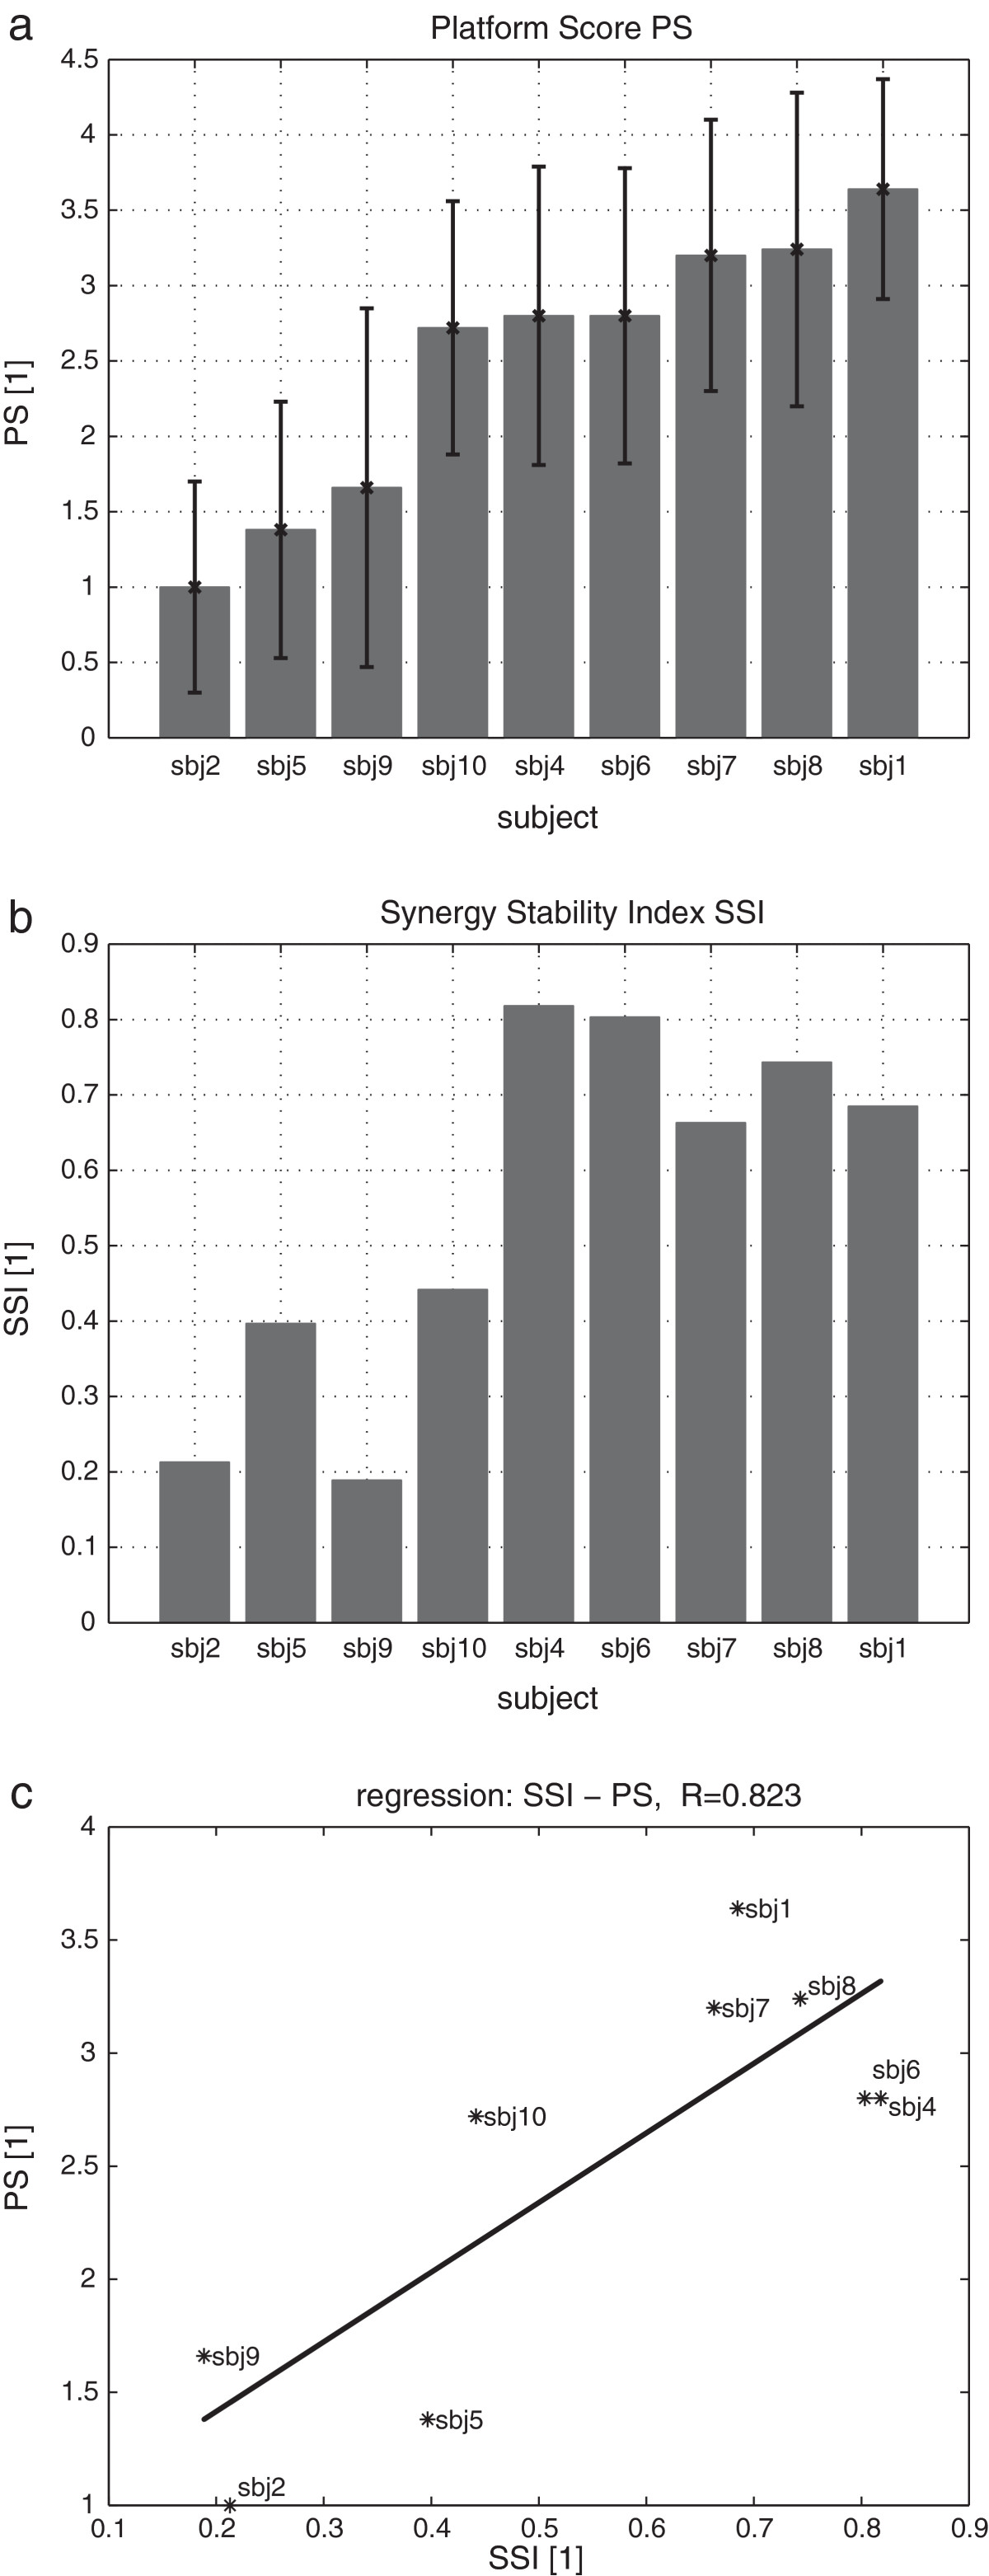
PS and SSI. a: PS of nine participants from the strong disturbance; b: SSI of nine participants from the weak disturbance; c: Relation between SSI and PS, with linear least squares regression (solid line).

PS and SSI. a: PS of nine participants from the strong disturbance; b: SSI of nine participants from the weak disturbance; c: Relation between SSI and PS, with linear least squares regression (solid line).