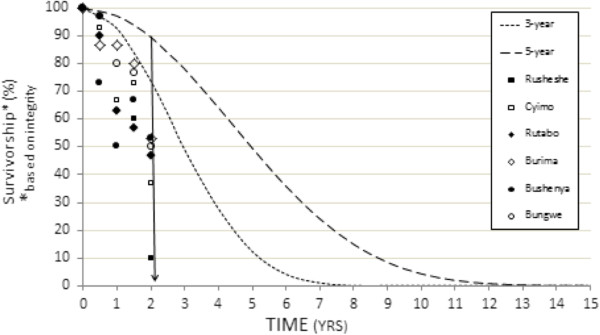
Figure 5.

LLIN observed integrity (data from Table 4 expressed as survivorship) versus NetCALC-predicted ‘proportion of LLINs present’ assuming either a 3-year or a 5-year LLIN replacement cycle. The vertical line bisecting the two year time point (x-axis) facilitates comparison of observed and predicted survivorship.
