Figure 5.

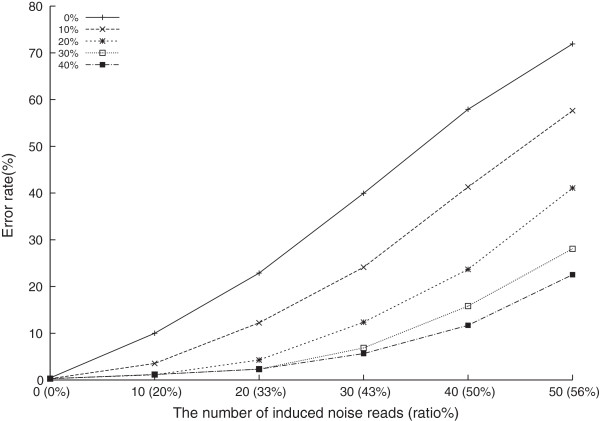
The change of error rates with different levels of noise reads. Experiments of Type 2 HLA-A using BayesTyping1 with different levels of m, which is the ratio of noise reads assumed.

The change of error rates with different levels of noise reads. Experiments of Type 2 HLA-A using BayesTyping1 with different levels of m, which is the ratio of noise reads assumed.