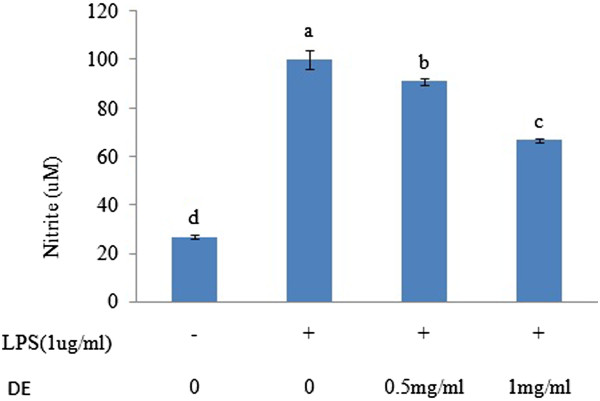
Figure 1.

Effects of DE on NO production. RAW 264.7 cells were pretreated with different concentrations of DE (0, 0.5 and 1 mg/mL) and then treated with LPS (1 μg/mL). The medium was harvested 24 h later and assayed for nitrate production. Data are the mean ± SD of at least three experiments. Bars within the same panel with different letters are significantly different (P < 0.05).
