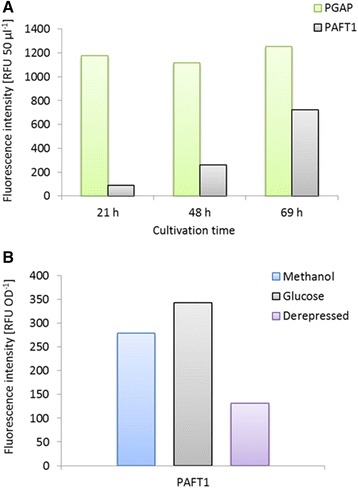
Figure 3.

Characterization of the AFT1 promoter. (A) GFP expression levels under control of PGAP and PAFT1. Cultivation in 96-well plate. RFU: relative fluorescence units, average of 87 P. pastoris clones. (B) GFP expression levels under control of PAFT1 using different cultivation conditions. Glucose: cultivation time 69 h, 2% glucose batch, 3 times addition of glucose to 0.5%. Methanol: cultivation time 92 h, 48 h glucose batch (1%), 3 times addition of methanol to 0.5%. Derepressed: cultivation time 69 h, 2% glucose batch, no additional supplementation.
