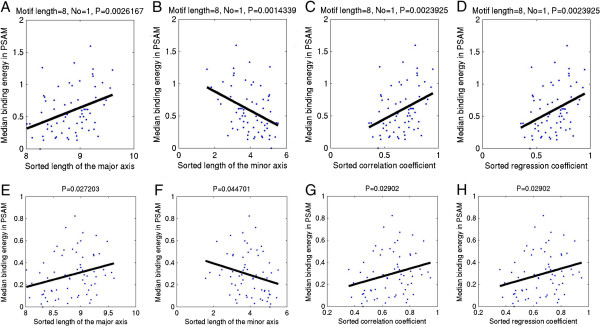
Figure 5.

Scatter plots of predicted binding energy-level in a motif versus sorted PBM quality parameters. A, B, C, and D are scatter plots of the median binding energy-level (i.e. E of a binding energy matrix where E < 0) in a motif predicted by BayesPI2 versus sorted length of the major axis of the PCA ellipse, sorted length of the minor axis of the PCA ellipse, sorted correlation coefficients of normalized 8-mer median intensities between paired PBMs, and regression coefficients, respectively. E, F, G, and H are scatter plots of the median binding energy-level (i.e.  where f is the probability in PWMs and E < 0) in a motif provided by the DREAM5 challenge versus sorted length of the major axis of the PCA ellipse, sorted length of the minor axis of the PCA ellipse, sorted correlation coefficients of normalized 8-mer median intensities between paired PBMs, and regression coefficients, respectively. Both PCA ellipse (i.e. 99.73% limit of PCA quality-control ellipses) and regression coefficients are based on scatter plot of normalized 8-mer median intensities between a pair of training and testing PBM experiments. For 66 mouse TFs, the median binding energy-level of a TF is the log-normalized median of the negative energies (i.e. log(-E)) in the binding energy matrix (i.e. E was the first predicted binding energy matrix by applying BayesPI2 energy-independent model on the probe intensities of PBM training experiments). In the figures, the black smooth line is a fitted linear regression line to the scatter plot, P-value to the regression line is shown at the top of each figure.
