
Figure 6.
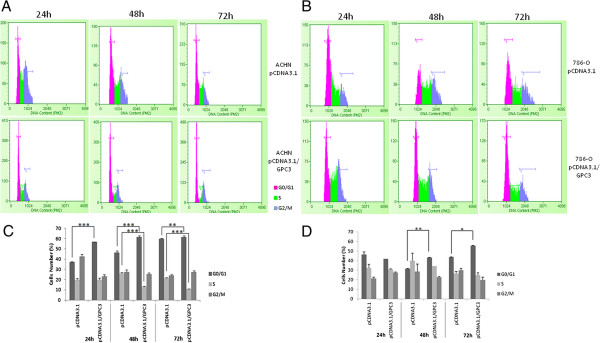
Effect of GPC3 on cell cycle in cell lines. A) ACHN cell cycle histogram. B) 786-O cell cycle histogram. C) The number of ACHN pcDNA3.1/GPC3 cells was significantly increased during the G1 phase (24 h and 48 h ***p < 0.001, 72 h **p < 0.01, ANOVA) and decreased during the S phase (48 h and 72 h ***p < 0.001, ANOVA). D) The number of 786-O pcDNA3.1/GPC3 cells was significantly increased in the G1 phase 48 h (**p < 0.01, ANOVA) and 72 h (*p < 0.05, ANOVA) post-transfection.