Figure 14.

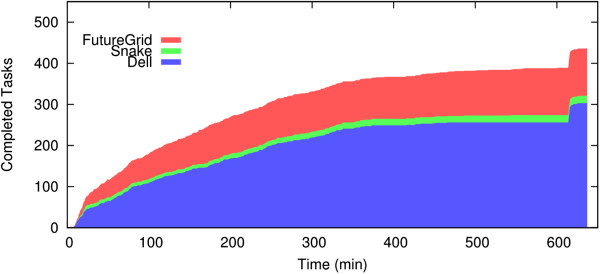
The number of completed tasks over time when testing the CBIR algorithm using the renal glomeruli dataset. The area under “FutureGrid” represents the contribution from the cloud resources.

The number of completed tasks over time when testing the CBIR algorithm using the renal glomeruli dataset. The area under “FutureGrid” represents the contribution from the cloud resources.