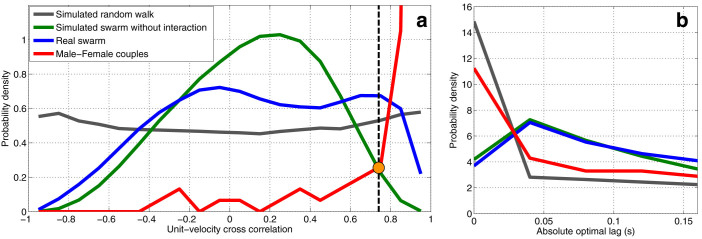
Figure 2. Frequency distribution of correlation values and optimal lags for real and simulated swarms.

(a), Unit-velocity cross correlation probabilities calculated for 8 real swarms and 8 coupling flights, normalized to have unit integral. The vertical dashed line passing through the orange dot indicates the threshold for interaction. The area under each curve to the right of the threshold shows the proportion of the pairs that are classified as interacting. (b), Probability density of optimal lags calculated for interacting pairs; by symmetry, the absolute value is used.
