
Fig. 2.
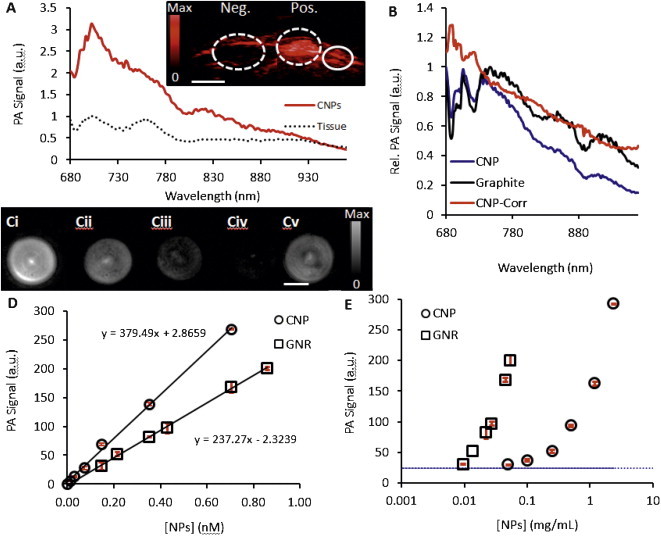
Photoacoustic signaling of CNPS. (A) Spectral imaging of CNPs highlights the maximum absorbance peak at 700 nm, which was used for all subsequent imaging experiments (red solid curve). The background PA spectrum of normal tissue is also shown for reference (black dots). Inset is a photoacoustic image of a subcutaneously implanted bolus of CNPs at 0.5 mg/mL (“Pos.”) and matrigel only implant (“Neg.”). Solid circle highlights a normal region used to create the tissue-only spectrum. Scale bar in inset is 3 mm. (B) Normalized photoacoustic data for the CNPs as well as “flat” graphite absorber illustrate change in laser power as a function of wavelength that has been reported previously [32]. This allows calculation of a normalized photoacoustic spectrum for the CNP (blue) that corresponds nicely to the absorption data (Fig. 1E). (C) Representative photoacoustic imaging data of a phantom scanned with the tomographic imaging system. Ci–Civ are CNPs. Bi: 0.70 nM, Bii: 0.35 nM; Biii: 0.15 nM; Biv: 0.07 nM. Bv is 0.70 nM GNRs. Scale bar in B is 4 mm. Photoacoustic data collected with the tomographic scanner for both CNPs and GNRs with 700 nm incident radiation using either molar (D) or mass units (E). Error bars in C are plotted in red and represent the standard deviation of 3 replicate samples and are <10% RSD.