
Fig. 4.
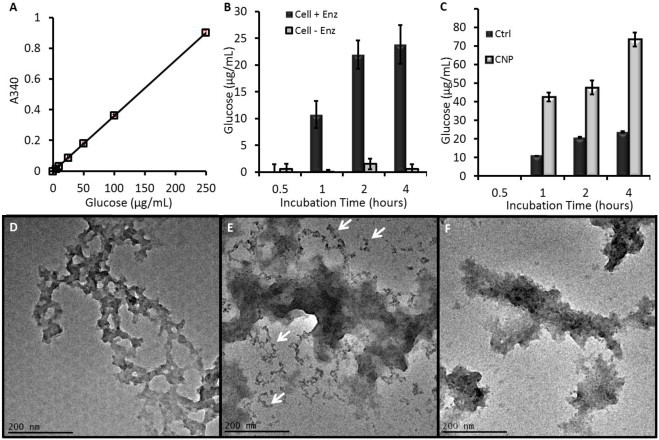
Biodegradation data of CNPs. (A) A hexokinase glucose assay was validated with standards. (B) The activity of the cellulase enzyme was validated with a cellulose standard and caused increased glucose concentration in samples with cellulase, but not the control samples. All points except 0.5 h were significant at p < 0.01. (C) Both control (raw cellulose) and CNPs produced glucose in the presence of cellulase suggesting biodegradation. Error bars in (A–C) represent the standard deviation of at least 3 replicate measurements. The CNPs had statistically elevated glucose levels that were above raw cellulose at p < 0.05 for all points above 0.5 h. (D) TEM imaging of naïve CNPs compared to CNPs treated with heat and acidic cellulase (E) and heat/acid only (F). Smaller fragments in the cellulase-treated CNPs are highlighted by black arrows.