
Fig. 5.
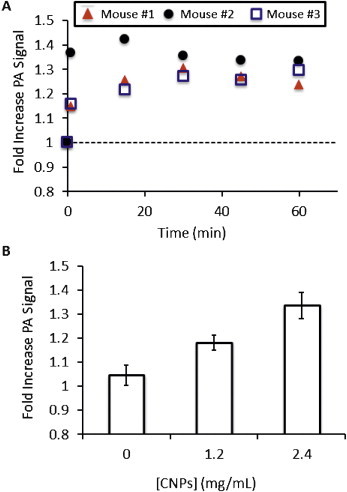
In vivo imaging with CNPs. (A) Time-activity curves of CNP in a subcutaneous murine model of human ovarian cancer (OV2008 line). Three different animals were imaged before (0) and 1, 15, 30, 45, and 60 min after tail-vein injection of 200 μL of 2.4 mg/mL CNPs and photoacoustic signal was divided by the PA signal pre-injection to give the relative units graphed here. The dashed line indicates no increase above baseline. All three animals showed maximum intensity 15–30 min after injection. This pattern was also seen at the other concentration values presented in panel (B). In Panel B the fold-increase above baseline is again plotted and all concentration values examined here are statistically significant above baseline at p < 0.05. Error bars in (B) represent the standard error for the three animals and the relationship between PA signal and concentration of injected contrast was linear at R2 > 0.96.