Figure 2.

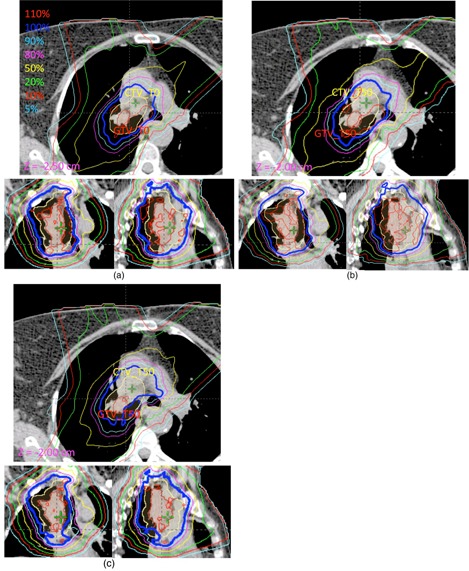
CT images showing dose deformation and 4D dose calculation for (a) one slice of a predeformed T0 dose at T0 of the 4D CT (), (b) same slice of postdeformed T0 dose at T50 of the CT (), and (c) same slice of T50 dose at T50 of the CT ().

CT images showing dose deformation and 4D dose calculation for (a) one slice of a predeformed T0 dose at T0 of the 4D CT (), (b) same slice of postdeformed T0 dose at T50 of the CT (), and (c) same slice of T50 dose at T50 of the CT ().