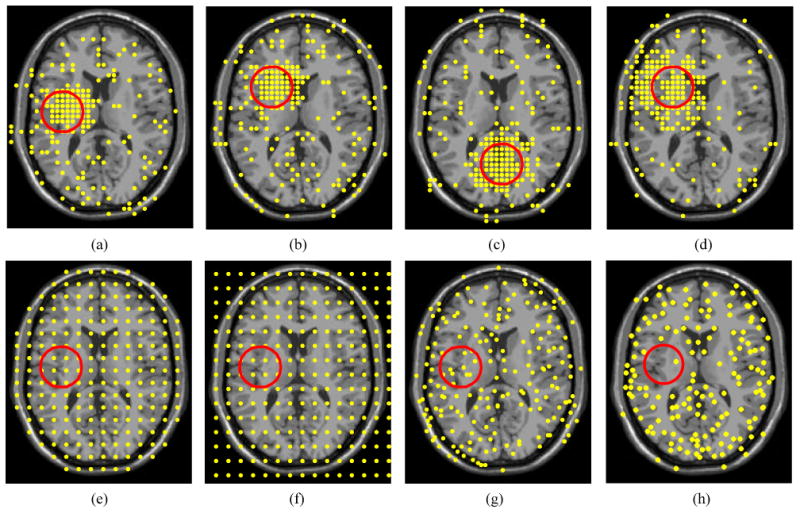
Figure 2.

The landmarks are selected by: The LeFiR method under the deformation profiles (a)
 (fi, lm, mm), (b)
 (fo, la, mm), (c)
 (fi, lb, mm), and (d)
 (fi, la, mi); (e) UniG; (f) FFD; (g) SURF; (h) SIFT. The yellow points represent landmarks, and the red circle indicates the deformed region. The landmark configurations generated by the LeFiR method exhibited a unique pattern where the points located within and near the deformed region were selected. Identifying the landmarks in the presence of the deformation could help more accurately drive the registration compared to the UniG, FFD, SURF, and SIFT methods.
