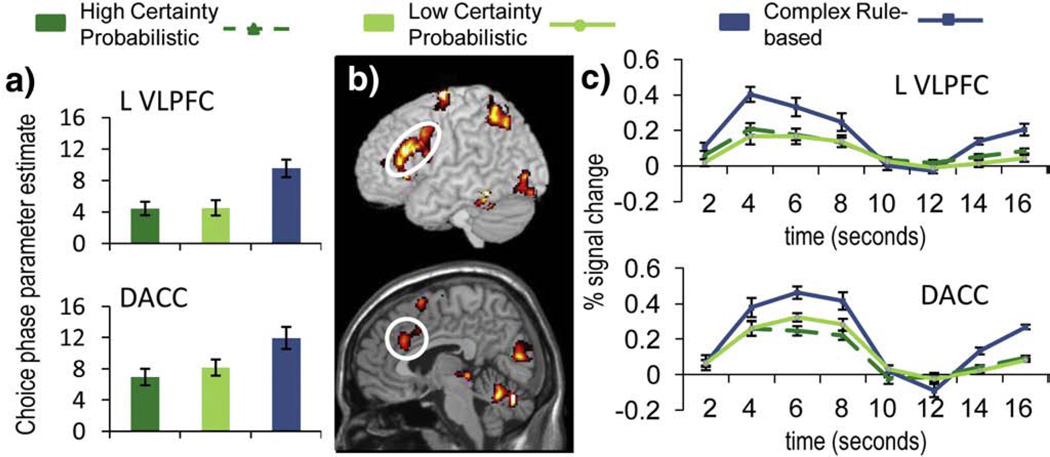
Fig. 3.
VLPFC and DACC regions of interest defined by the complex rule-based choice versus high choice certainty probabilistic choice contrast. Center column shows t-statistic maps from the complex rule-based choice versus high choice certainty probabilistic choice contrast (top: VLPFC, bottom: DACC; threshold at p<.001 uncorrected, 10 contiguous voxels), (a) Choice phase parameter estimates for high choice certainty probabilistic, low choice certainty probabilistic, and complex rule-based conditions, (b) Outcome phase parameter estimates for probabilistic choice positive outcomes, probabilistic choice negative outcomes, and complex rule-based positive outcomes. Significant differences (two-tailed, p<.05) are denoted in (b) with a ‘*’. (c) VLPFC (top) and DACC (bottom) activation time course for high choice certainty probabilistic, low choice certainty probabilistic, and complex rule-based conditions. Onset of the choice phase corresponds to 0 s. Error bars in each chart represent the standard error of the mean.

