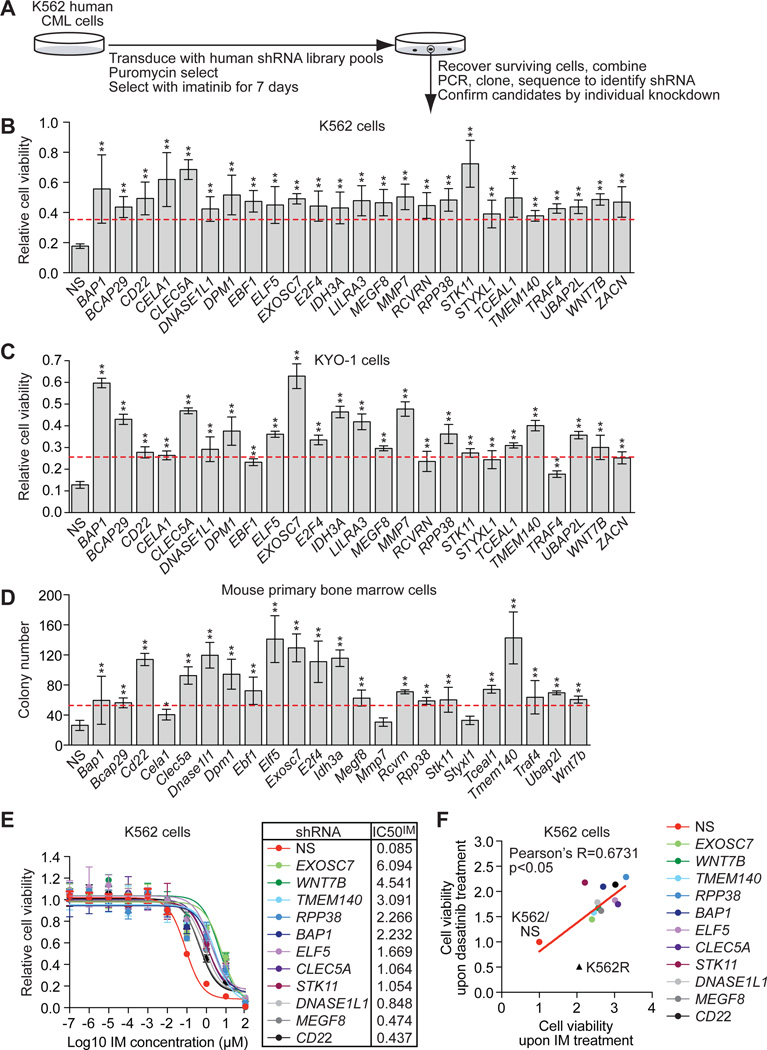
Fig. 1. A large-scale shRNA screen identifies IMSGs.
(A) Schematic summary of the screen. (B) Relative viability of IMSG KD K562 cells in the presence of IM, as measured by MTT assay (n=4). The results were normalized to that obtained with DMSO-treated cells, which was set to 1. IMSG shRNAs that conferred >2-fold increase in cell survival (indicated by the red line) relative to the NS control shRNA were considered positive. (C) Relative viability of IMSG KD KYO-1 cells in the presence of IM, as measured by MTT assay (n=4). The results were normalized and positives determined as described in (B). (D) Colony formation assay monitoring survival of BCR-ABL+ mouse primary bone marrow cells expressing an IMSG shRNA in the presence of IM (n=3). IMSG shRNAs that conferred >2-fold increase in colony number (indicated by the red line) relative to the NS control shRNA were considered positive. (E) Relative IC50IM of IMSG KD K562 cells (n=4). (F) Cell viability, as measured by MTT assay, of IMSG KD K562 cells treated with 500 nM dasatinib or 10 µM IM for 3 days (n=4). K562 cells expressing an NS shRNA (K562/NS) and IM-resistant K562 cells (K562R) were analyzed as controls. Data are represented as mean ± SD. *P≤0.05, **P≤0.01. Statistical tests and exact P values are provided in table S4.

