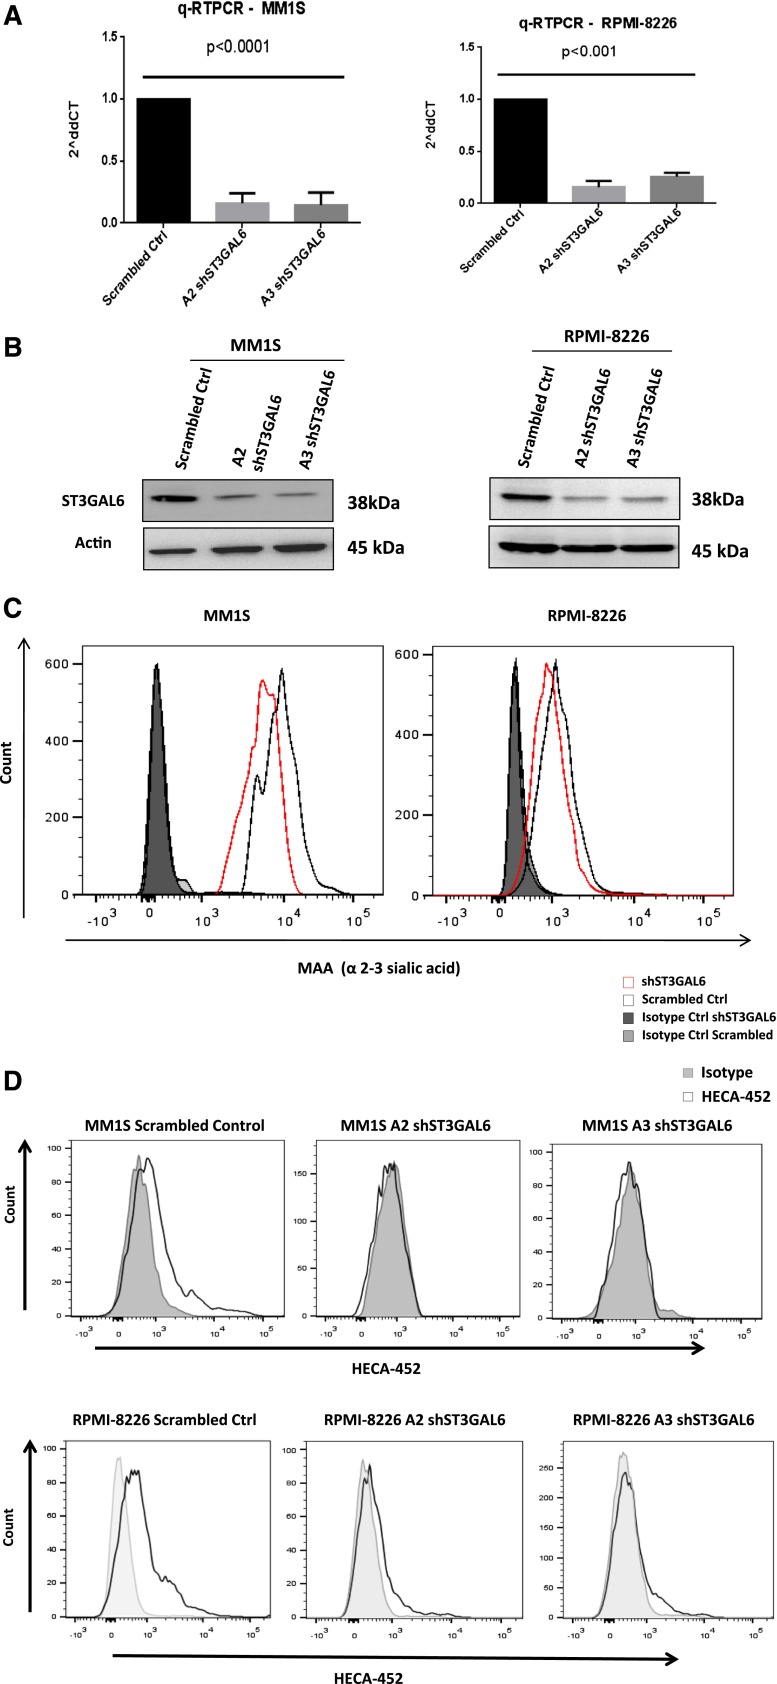
Figure 4.
ST3GAL6 Knockdown MM cell lines. (A) qRT-PCR demonstrating efficiency of lentiviral-mediated knockdown of ST3GAL6 in MM1S (left) and RPMI-8226 (right) cell lines vs corresponding scrambled controls. shST3GAL6 MM1S cells vs scrambled control, P < .0001; shST3GAL6 RPMI-8226 cells vs scrambled controls, P < .001. (B) Western blot analysis for ST3GAL6 protein expression in MM1S and RPMI-8226 cell lines compared with scrambled controls, demonstrating significant reduction of protein expression in knockdown cell lines. (C) Flow cytometry demonstrating reduced expression of MAA lectin on MM1S and RPMI-8226 cells after the knockdown of ST3GAL6 in these cell lines. Comparison of MFIs: MM1S scrambled vs MM1S A2 clone, P = .0006; RPMI-8226 scrambled vs RPMI-8226 A2 clone, P = .001. (D) Flow cytometry demonstrating reduced expression of HECA452 on MM1S and RPMI-8226 shST3GAL6 cells compared with scrambled control cells. Comparison of MFIs: MM1S scrambled vs MM1S clone A2, P = .014; scrambled vs MM1S clone A3, P = .0059. RPMI scrambled vs RPMI-8226 clone A2, P = .005; scrambled vs RPMI-8226 clone A3, P = .001.

