
FIGURE 7. Electrostatic potential isocontours for the WT and Arg555Trp mutant FAS1-4 domains.
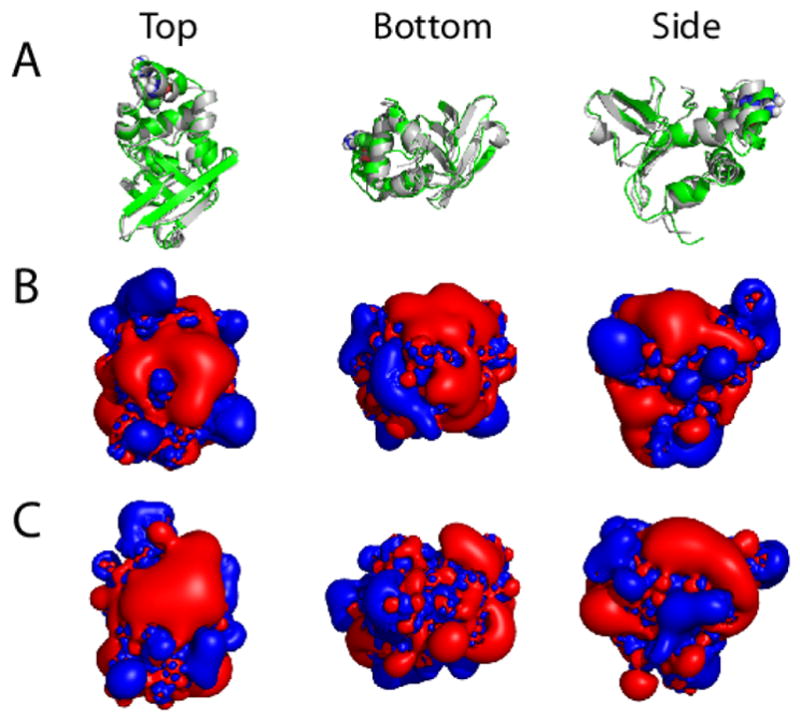
The lowest energy NMR structure minimized in a water box and ionized with NaCl was used as input for the APBS calculations of the electrostatic potential isocontours. (A) Overlaid ribbon plots for the WT structure (grey) and the Arg555Trp mutant structure (green), (B) electrostatic potential isocontours for the WT FAS1-4 domain, and (C) electrostatic potential isocontours for the Arg555Trp mutant FAS1-4 domain shown in three different molecular orientations: top (left), bottom (middle), and side (right) views. Red and blue colours in (B, C) represent electrostatic potentials of +1 and −1 kT/e, respectively. From the top view it is clear that translation of the α3′-helix in the more compact Arg555Trp mutant structure (left, panel C) induces a larger connected positively charged surface in the mutant FAS1-4 domain compared to the WT structure (left, panel B).