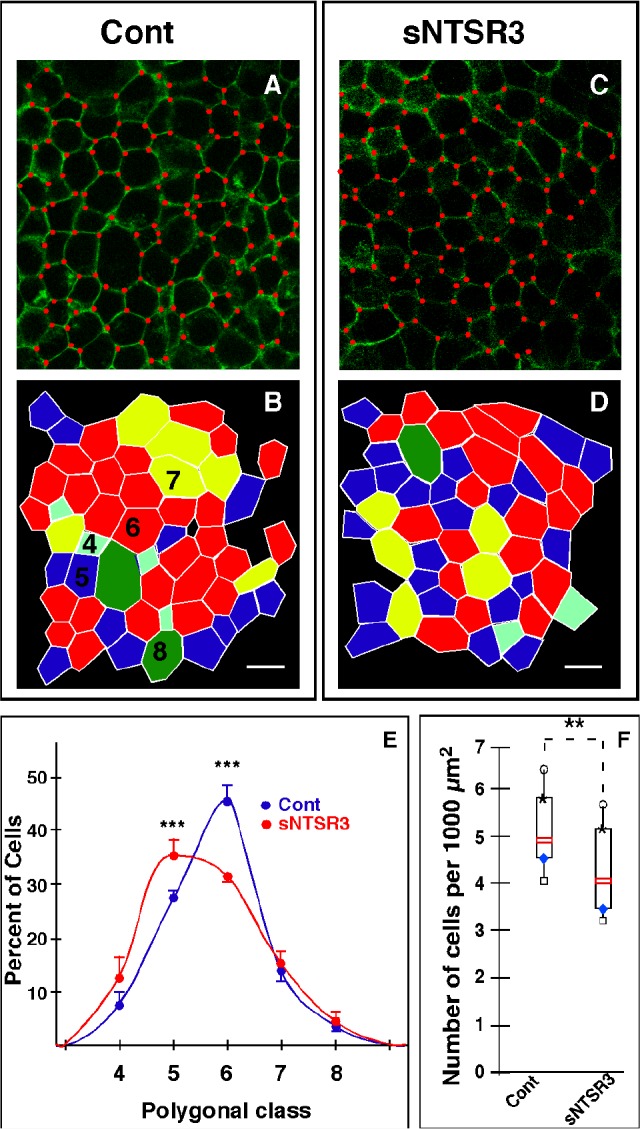
Figure 1. sNTSR3 regulates HT29 cell topology.

A-D- Cells were serum-starved and stimulated (C) or not (A) with sNTSR3 (10−8M) for 15h. Vertices were identified with red dots to count the number of edges of each cell. B and D assigned polygon classes of A and C respectively, tetragons (cyan), pentagons (blue), hexagons (red), heptagons (yellow) and octagons (green). E- Distribution of polygon classes for control (blue circles) or following sNTSR3 incubation (red circles). Scale bar = 20 μm; values are mean ± SEM from three independent determinations (*** p<0.005). The number of counted cells was 252 for resting cells and 265 for sNTSR3 treated cells from 3 independent experiments. F- Cells were numbered by image analysis using ImageJ (Wayne Rasband, National Institute of Mental Health, Bethesda, Maryland, USA) software and an home-made macro to detect and count nuclei normalized by a surface unit for each image. The number of cells per 1000 μm2 was expressed as median value obtained from 10 determinations for each condition, box plots show medians, 25% and 75% percentiles, and 5% and 95% percentiles. **p < 0.01. The number of counted cells was 520 for resting cells and 372 for sNTSR3 treateed cells from 5 independent experiments.
