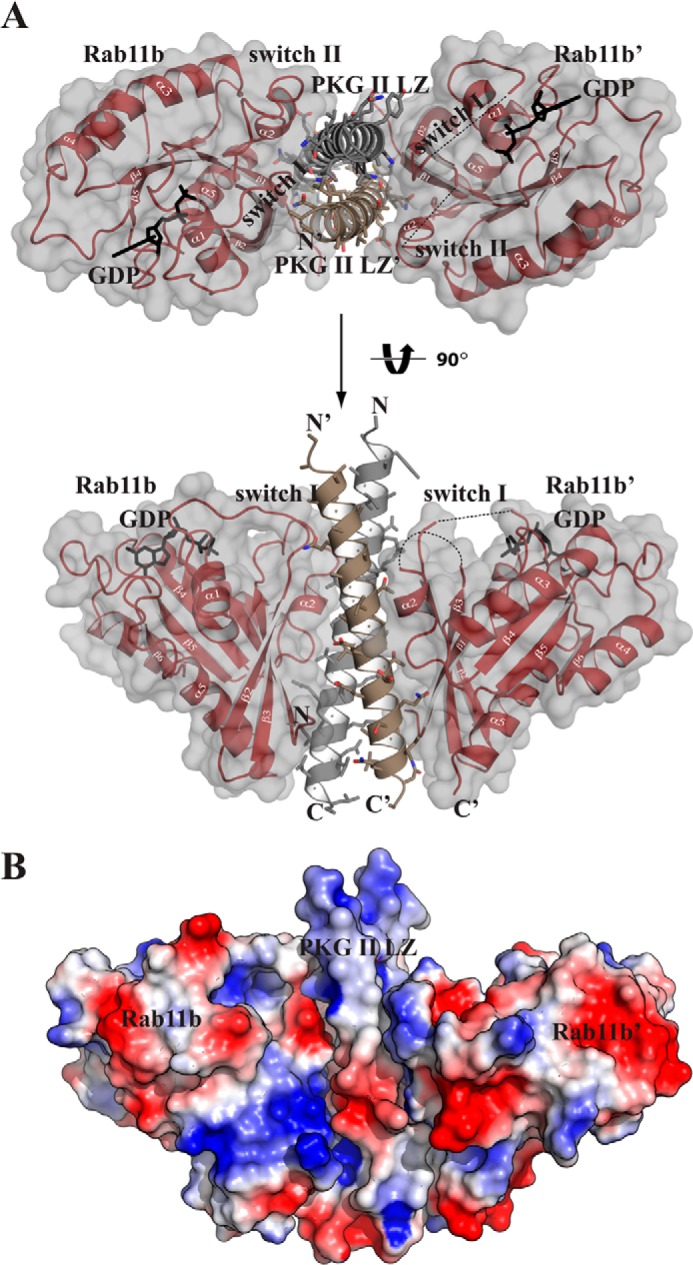
FIGURE 2.

Crystal structure of the PKG II LZ-Rab11b complex. A, structure of the PKGII LZ-Rab11b complex with the secondary structure elements labeled. The disordered switch I and II regions of Rab11b′ are shown as a dotted lines. All structure images were generated using PyMOL (Delano Scientific). B, surface representation of the complex is shown, colored according to its electrostatic potential (red, electronegative; blue, electropositive).
