FIGURE 9.
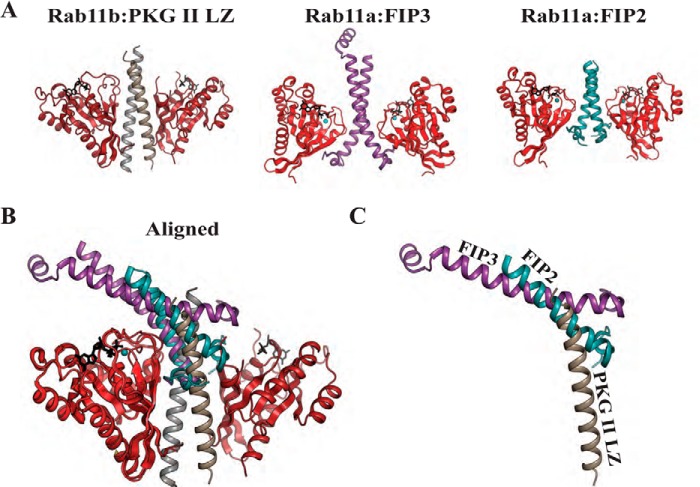
Structural comparison of the PKG II LZ-Rab11b complex with Rab11a-FIP complexes. A, cartoon representations of the Rab11b-PKG II LZ complex, Rab11a-FIP2 (PBD code 2HV8) (25), and Rab11a-FIP3 (PDB code 2GZD) (24) with PKG II LZ and FIPs aligned. B, complexes aligned with molecules of Rab11. Note that the FIP binding region is mainly along switch I and II of Rab11a, whereas PKG II LZ interacts mainly in the interswitch and N-terminal region of Rab11b. C, view showing only the PKG II LZ, FIP2, and FIP3 highlights the steric clashes.

