FIGURE 5.
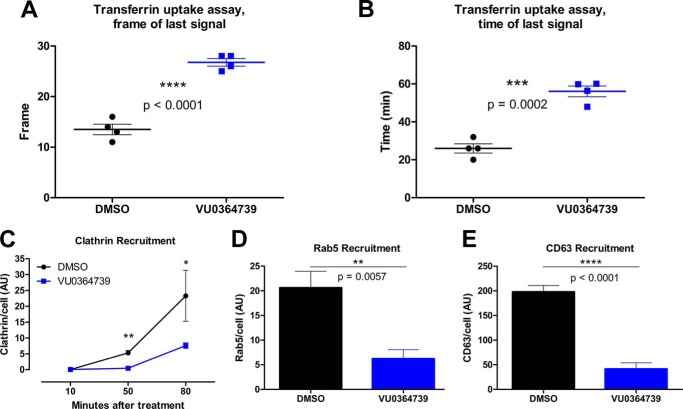
PLD inhibition alters ligand trafficking kinetics and accumulation of endocytosis regulatory proteins. A and B, A549 cells were treated for 1 h with DMSO or VU0364739 (10 μm) prior to being labeled for 1 h at 4 °C with 100 nm Alexa Fluor 647-transferrin. Live cell imaging was used to assess the kinetics of transferrin uptake. To quantify this assay, both the frame (A) and the time (B) were used to determine when the fluorescent signal disappeared, signaling recycling of transferrin. Live cell imaging was performed using Slidebook imaging software, and frame time measurements were compared using t tests. Data are mean ± S.E. (error bars). C–E, A549 cells were treated for 1 h with DMSO or VU0364739 (10 μm) and then infected with 0.05 m.o.i. influenza A/California/04/2009 (H1N1). Cells were stained and examined by confocal microscopy for the accumulation of clathrin (C), Rab5 (early endosome) (D), and CD63 (late endosome) (E). Less clathrin is recruited at 50 and 80 min postinfection under inhibitor treatment, and less Rab5 (D) and CD63 (E) accumulate after 10 and 90 min postinfection. In these experiments, protein accumulation was defined by gating signal intensity as well as size such that higher y axis values represent bigger and brighter foci of signal. A two-way ANOVA with Bonferroni's post-test was used to examine data from C. t tests were used to analyze data from D and E with p values indicated. Data are mean ± S.E. (error bars). *, p < 0.05; **, p < 0.01; ***, p < 0.001; ****, p < 0.0001.

