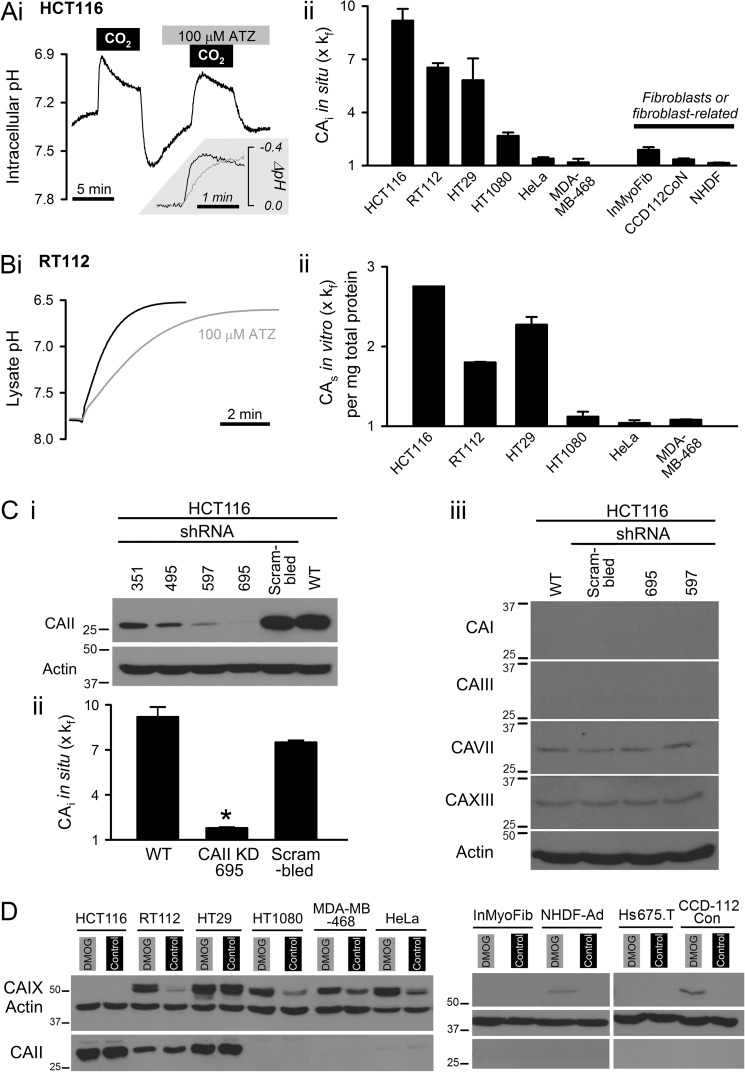
FIGURE 1.
Intracellular carbonic anhydrase activity. A, panel i, determination of cytoplasmic CO2 hydration rate from pHi dynamics in intact HCT116 cells (AM-loaded with pH dye cSNARF1). Switching between CO2/HCO3−-free and 5% CO2, 22 mm HCO3−-containing superfusate triggers intracellular CO2 hydration. The experiment was repeated with 100 μm ATZ to inhibit CA. Inset, pHi response to CO2 addition. Panel ii, CAi activity in cancer and fibroblast/fibroblast-related cells (n > 20 each), normalized to measurements in the presence of ATZ (kf = 0.18 s−1). B, panel i, measuring CA activity in membrane-free RT112 lysates. Panel ii, CAs activity normalized to spontaneous rate determined in ATZ (expressed per mg/ml of total protein). C, panel i, knockdown of CAII in HCT116 cells using one of four shRNA constructs, scrambled shRNA (sham) and non-transfected wild type (WT). *, p < 0.05, relative to WT. Panel ii, total CAi activity in knockdown, sham, and WT HCT116 cells (n > 20 each). Panel iii, Western blot for soluble CA isoforms other than CAII in HCT116 cells treated with shRNA. D, Western blot for CAII and CAIX under control (normoxic) incubation or 48 h in 1 mm dimethyl oxalylglycine (DMOG). Error bars represent S.E.

