FIGURE 1.
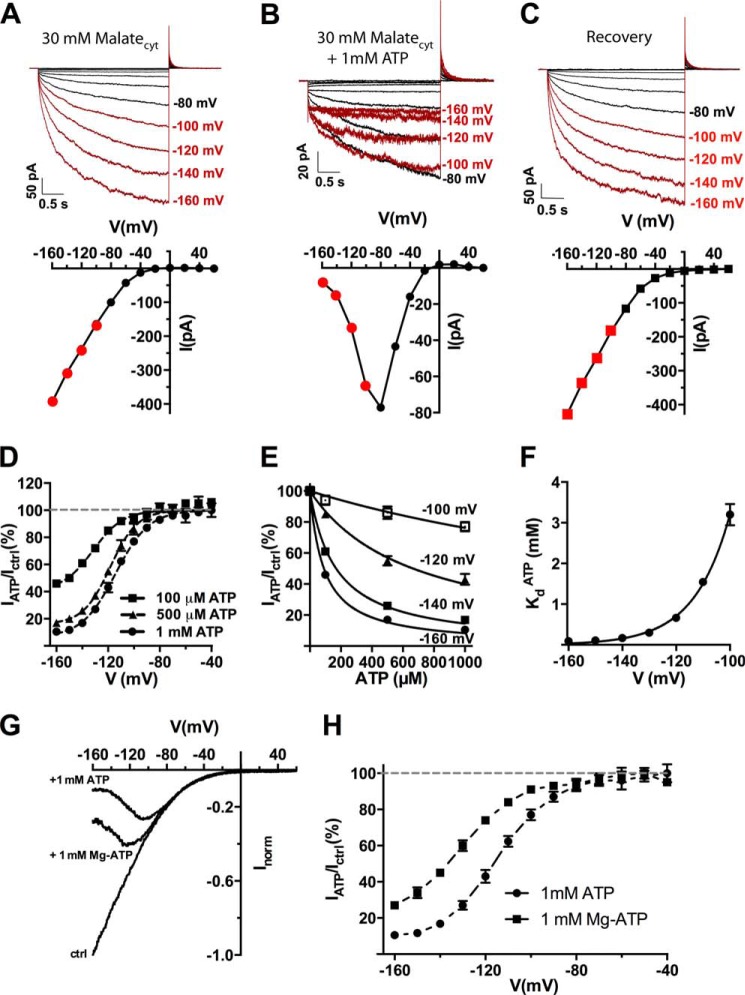
Cytosolic ATP reversibly blocks AtALMT9-mediated currents in a voltage-dependent fashion. A–C, representative traces and corresponding I-V curves of excised cytosolic-side out patches from N. benthamiana vacuoles overexpressing AtALMT9 in 30 mm malatecyt, 100 mm malatevac (A), 30 mm malatecyt + 1 mm ATPfree, 100 mm malatevac (B), and recovery (C). Currents were evoked in response to 3-s voltage pulses ranging from +60 to −160 mV in −20 mV steps, followed by a tail pulse at +60 mV. The holding potential was set at +60 mV. Red highlights the currents at the membrane potentials where the ATP inhibition was effective. D, ratio between currents measured in the absence (Ictrl, 30 mm malatecyt, 100 mm malatevac) and presence of the indicated concentrations of ATPcyt (IATP, 30 mm malatecyt + X mm ATPfree, 100 mm malatevac) at different applied membrane potentials. Data were fitted with Equation 3 (see “Experimental Procedures”; dashed line) (n = 4–7). E, dose-response curves for ATPfree at different membrane potentials. Data were fitted with Equation 1 (see “Experimental Procedures”; solid lines) to derive the dissociation constant (KdATP). F, voltage dependence of the dissociation constant for ATP (KdATP) in 30 mm malatecyt, 100 mm malatevac. Solid line, data were fitted with Equation 2. G and H, inhibitory effect of Mg-ATP. G, normalized current-voltage curves were obtained with a voltage ramp (from +60 to −160 mV in 1.5 s) with 30 mm malatecyt, 100 mm malatevac and in 30 mm malatecyt, 100 mm malatevac in the presence of 1 mm ATPfree (+1 mm ATP) or Mg-ATP (1 mm Mg-ATP). H, residual currents (IATP/Ictrl; mean ± S.E., n = 3–7) plotted against the applied voltage in the presence of 1 mm ATPfree or Mg-ATP. Data were fitted with Equation 3 (dashed line). Error bars denote S.E.

