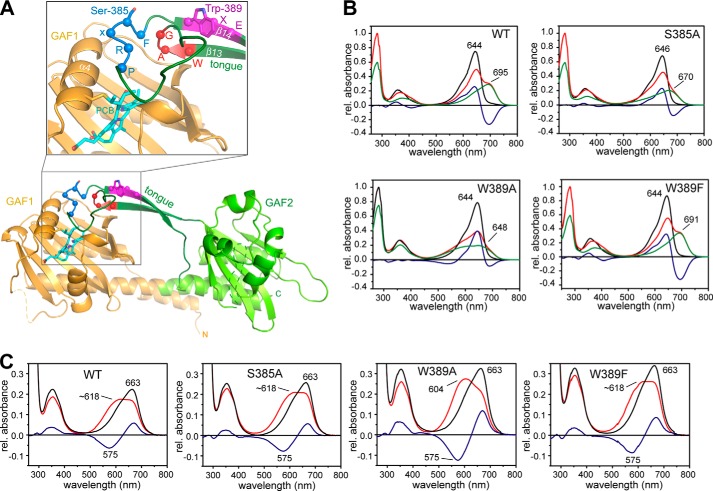
FIGURE 1.
Structure of SynCph2(1-2) (Protein Data Bank code 4BWI), including the positions of the mutations in the tongue region and absorbance of UV-visible spectra of the variants. A, structure of SynCph2(1-2) with a detailed view of the chromophore binding pocket (inlay). The GAF1 domain is displayed in orange, and the GAF2 domain with the tongue region is displayed in green, respectively. The PCB chromophore is shown in cyan. Amino acid positions Ser-385 and Trp-389 as well as the cofactor binding Cys-129 are displayed in stick representation. The residues of the conserved W(G/A)G, PRXSF, and WXE motifs are depicted as spheres, and the motifs are highlighted in red, blue, and magenta, respectively. B, steady state UV-visible absorbance spectra of SynCph2(1-2) and the variants S385A, W389A, and W389F as shown in Ref. 8 after far-red (Pr state, black line) and red light illumination (red line). Difference spectra are calculated with APr − APhotoequilibrium and shown in blue. Deconvoluted, pure Pfr (or red light-adapted) spectra are presented in green (9). At the photoequilibrium, a portion of 59% Pfr-like state for S385A, 75% Palt for W389A, and 59% Pfr state for W389F are obtained in comparison with SynCph2(1-2) (60% (9)). C, UV-visible absorbance spectra of SynCph2(1-2) as well as S385A, W389A, and W389F after denaturation with acidic urea (denatured Pr state, black line; denatured red light-adapted state, red line; difference spectrum, blue line).

