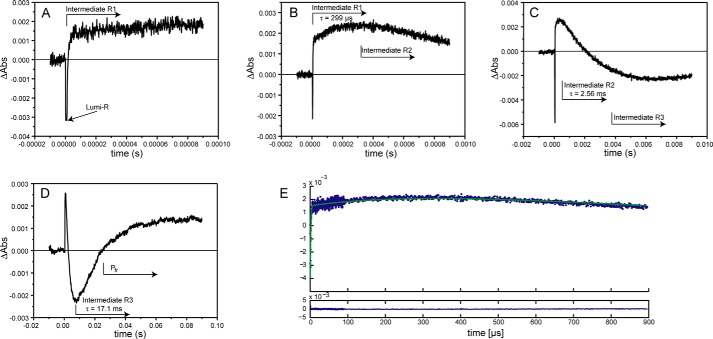
FIGURE 2.
Single time traces of the SynCph2(1-2) Pr → Pfr transition measured at 665 nm. Here, the intermediates show alternately lower or higher absorbance than the Pr reference state and can be observed without further data analysis. A–D show the time traces with increasing time scales; the approximate appearance of intermediates is indicated by arrows. The intermediate lifetimes are also presented. The final intermediate R3 exhibits similar absorption as the Pfr conformation (D). The initial 10% of the time traces prior to the laser pulse are recorded to determine the baseline level; at t = 0 the laser flash triggered the photoconversion. E, individual time traces (A–D) were assembled. Here, the fit of the resulting data is shown in green as well as the residuals (below).

