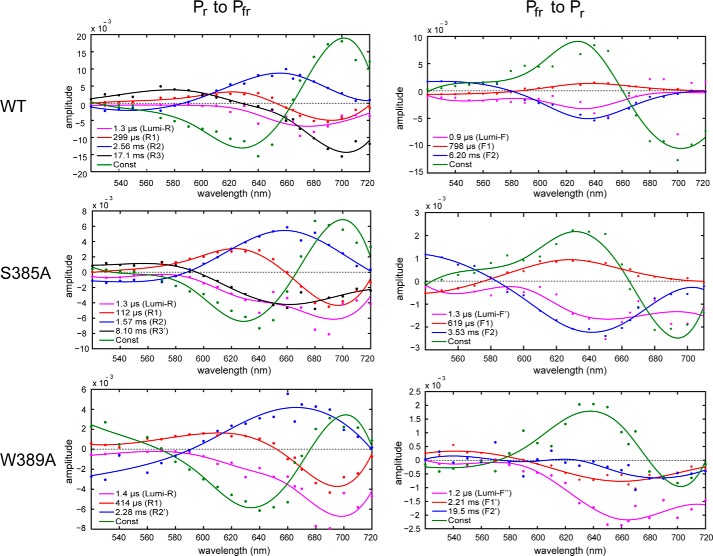
FIGURE 3.
LADS of SynCph2(1-2) (top panel) and its S385A (middle) and W389A variant (bottom) in the respective Pr → Pfr (left) or Pfr → Pr (right) transition. The lifetimes of the intermediates are shown in the inlays. The constant difference spectrum (green) reflects the subtraction of the starting state absorbance spectrum from the final state that should correspond to the difference between Pr and Pfr (Pr → Pfr transition: ΔA = A(Pfr) − A(Pr)). The other LADS show the subtraction of the intermediate spectrum from the previous intermediate spectrum (Pr → Pfr transition: ΔA = A(Intermediate1) − A(Intermediate2)). A positive absorbance difference in the LADS reflects an absorbance decay from the last to the considered intermediate, a negative signal of an absorbance increase.

