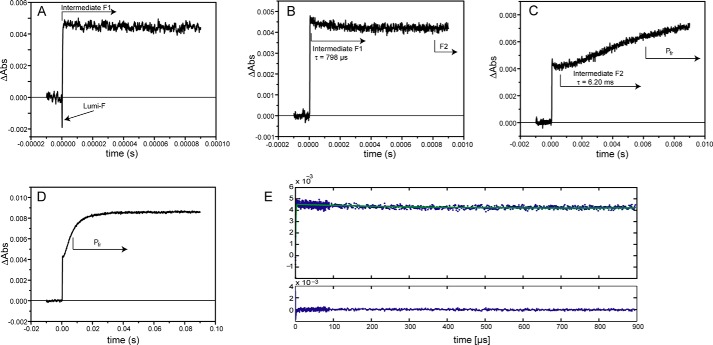
FIGURE 4.
Single time traces of the SynCph2(1-2) Pfr → Pr transition measured at 640 nm. The absorbance difference between the intermediates is not as high as in the forward reaction. A–D, single time traces with increasing time scales are shown as well as the assignment of the absorbance differences to the intermediates and their lifetimes. As in the forward reaction, the formation of the first intermediate lumi-F is too fast for the resolution of these measurements. E, fit of the assembled data from A to D (green) and its residuals.

