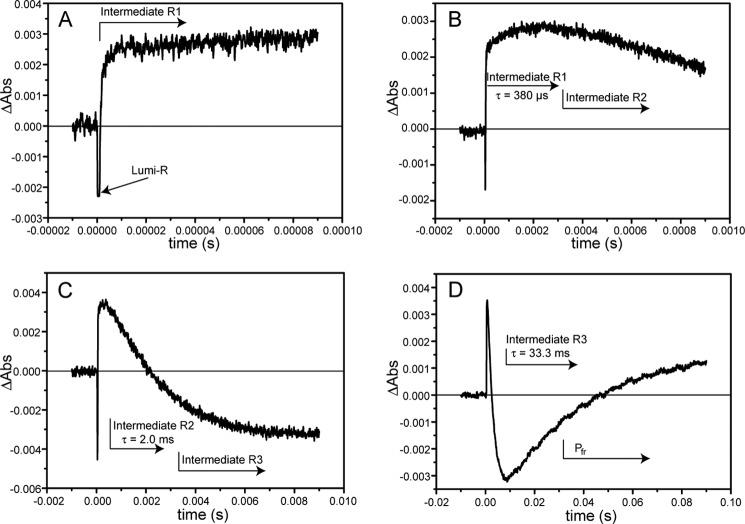
FIGURE 5.
Single time traces of the SynCph2(1-2) W389F Pr → Pfr transition measured at 665 nm. A–D shows the single time traces with increasing time scales that are similar to SynCph2(1-2). The intermediates with their lifetimes are indicated by the arrows. The lifetimes were calculated via fitting of the single time traces and are averaged over the different observed wavelengths.

