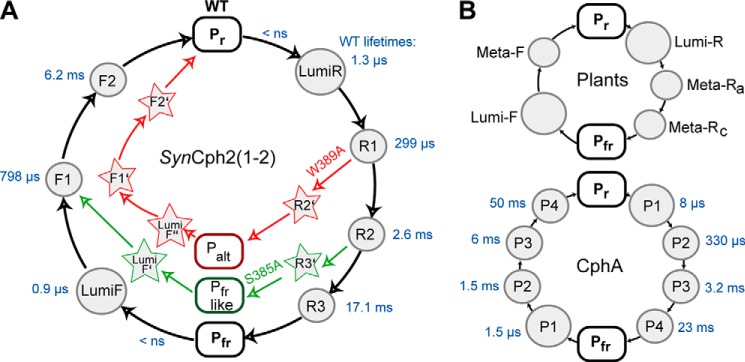
FIGURE 6.

A, photocycle of the group II phytochrome SynCph2(1-2) (black lines) and its S385A (green) and W389A (red) mutants. Rounded rectangles highlight the ground state Pr and the Pfr- or Pfr-like states. Circles indicate the intermediates of the SynCph2(1-2) photocycle. The lifetimes of the wild type intermediates are shown next to them in blue. Arrows indicate deviations from the native photocycle as caused by mutations within the tongue region. The corresponding intermediates are depicted with stars. Palt refers to an alternative red light-adapted state distinct from Pfr. B, photocycles of group I phytochromes. Only a minimal model is shown for the photocycle of plant phytochromes (top). The photocycle of CphA, another group I phytochrome, from the cyanobacterium Calothrix sp. PCC7601 (18) includes the lifetimes of the observed intermediates (blue) as obtained by a procedure comparable with SynCph2(1-2).
