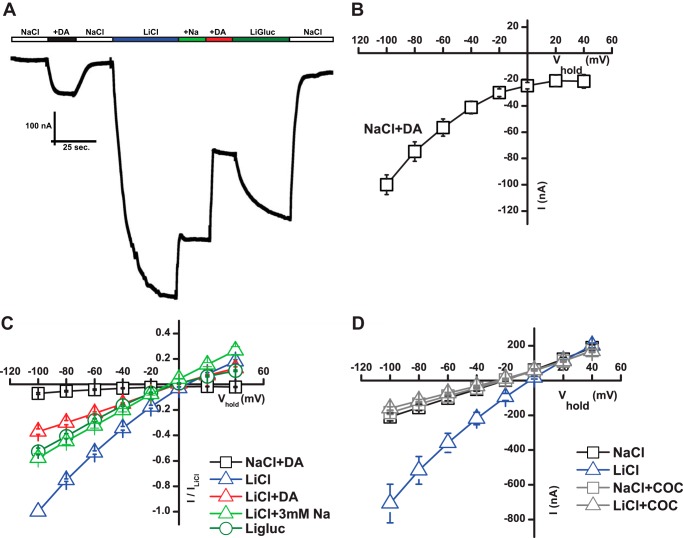
FIGURE 1.
DAT mediates a Li+-induced leak current. A, trace recording of mouse DAT expressing oocytes voltage-clamped at −60 mV. Buffer changes were made as indicated. The concentration of DA (+DA) was 20 μm and of Na+ (+Na) was 3 mm. The figure shows a representative trace. B, I/V plot of steady-state currents induced by DA (20 μm) with control (no DA) subtracted (means ± S.E., n = 6). C, I/V plot of steady-state currents in NaCl plus 20 μm DA (open squares), LiCl (open blue triangles), LiCl plus DA (open red triangle), LiCl plus 3 mm Na+ (open green triangle), and Ligluc (open circles). Data are normalized to the maximum response in LiCl (means ± S.E., n = 4–6). D, I/V plot of steady-state current showing responses in NaCl and LiCl in the absence and presence of cocaine (COC, 10 μm) (means ± S.E., n = 4–6). The I/V plots were generated in 20-mV steps from −100 to +40mV (B–D).

