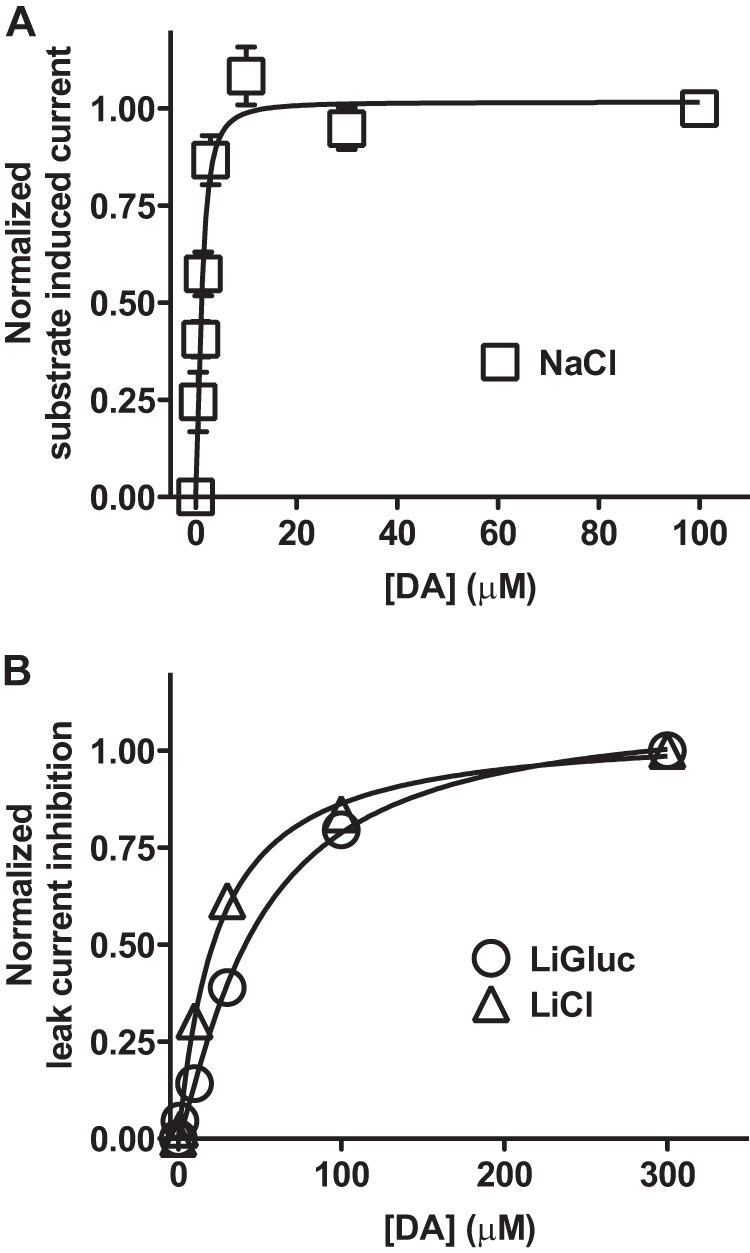
FIGURE 2.

The DA affinity is dramatically changed in the Li+-bound state of the transporter. A, substrate-induced current at −100 mV plotted as a function of increasing DA concentrations and normalized to the maximum response. EC50 = 1.19 ± 0.11 μm (mean ± S.E., n = 5). B, inhibition of the leak current by DA at −100 mV plotted as a function of increasing DA concentrations after normalization to the maximum inhibition (Ligluc). IC50LiCl = 23.5 ± 1.9 μm; mean ± S.E., n = 7. IC50Ligluconate = 48 ± 5 μm; mean ± S.E., n = 3).
