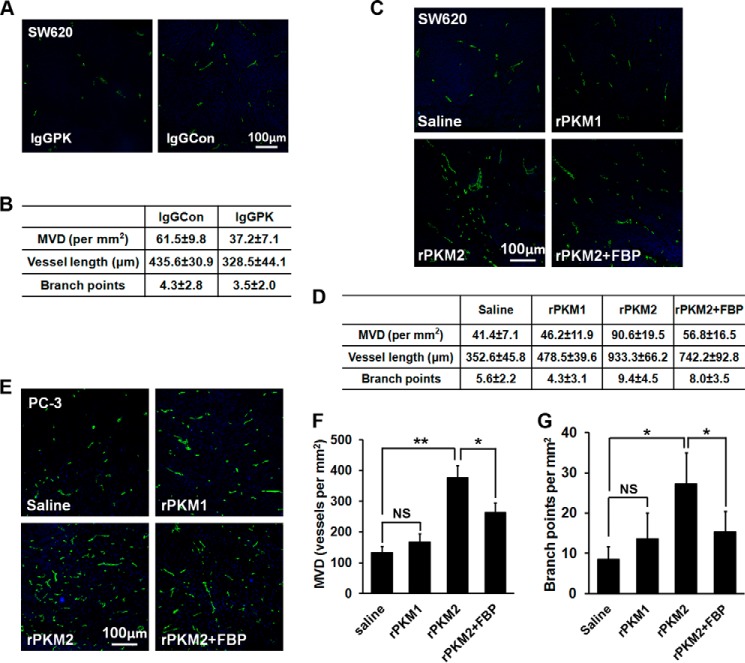
FIGURE 5.
PKM2 and the antibody against PKM2 affect tumor angiogenesis. A, C, and E, representative images of immunostaining of tissue sections prepared from the harvested tumors with antibodies against mouse CD31 (green). The blues in A, C, and E are DAPI staining of cell nuclei. B, D, F, and G, quantitative analyses of vessel lengths, densities, and branch points (manually counting) of the CD31 staining of the tumor tissue sections in 1 mm2 area using the software ImageJ. The quantification is the statistical mean of four randomly selected fields in three randomly selected sections from each tumor (A and B, SW620 tumor with PKM2 antibody treatment; C and D, SW620 tumor with rPKM2 treatment; E, F, and G, PC-3 tumor with rPKM2 treatment). The p values are presented by * (p ≤ 0.05), ** (p ≤ 0.01), or NS (statistically insignificant; p > 0.05) and were calculated using unpaired two-tailed Student's t test. The error bars in F and G are S.D. of the mean values from measurements of four randomly selected fields in three randomly selected sections from each tumor.

