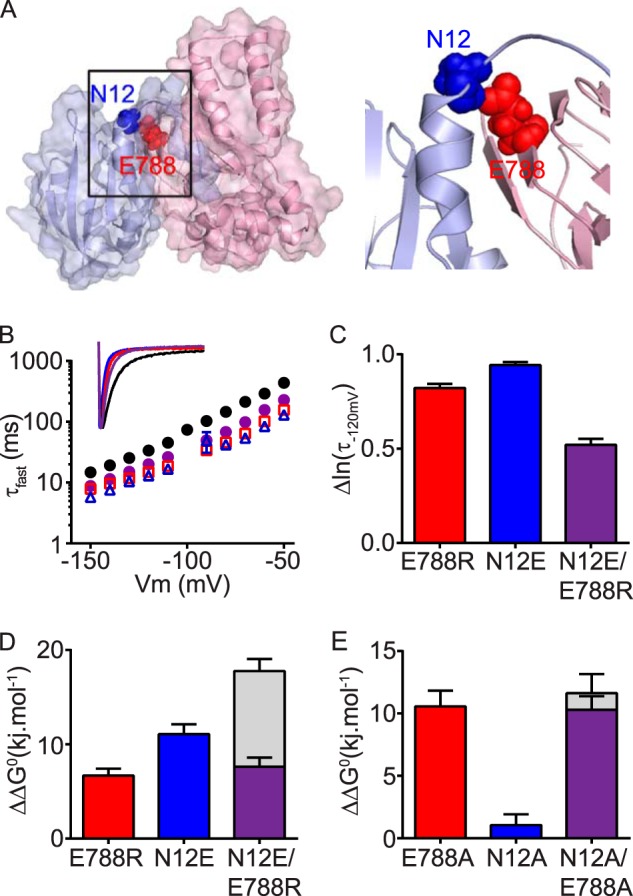
FIGURE 6.

cNBH domain residue Glu788 interacts with the N-Cap residue Asn12. A, surface representation homology model of the N-Cap/PAS domain (blue) interacting with the C-linker/cNBH domain (red). The N-Cap residue Asn12 (blue spheres) interacts with Glu788 (red spheres) of the cNBH domain. B, mean (± S.E.) rates of deactivation for WT Kv11.1 (black circles, n = 16), N-Cap mutant N12E (blue triangles, n = 5), cNBH domain mutant E788R (red squares, n = 21), and combined mutant N12E/E788R (purple circles, n = 8). Note that error bars are included but are within the symbols. Mean ± S.E. values for τfast, τslow, and the relative amplitudes of τfast to τslow for WT and all mutants are given in supplemental Table S1. Inset, representative current traces at −120 mV for each mutant are color-coded as above. C, summary (mean ± S.E.) showing that the combined mutant N12E/E788R has slower deactivation kinetics, measured as smaller Δln(τ−120 mV) compared with WT Kv11.1, than either of the two single mutants alone. D and E, summary (mean ± S.E.) ΔΔG0 for charge reversal (D) or alanine (E) mutant channels compared with the WT. Note that the effects of the two single mutants are not additive when combined in the double mutant N12E/E788R. Gray bars represent the theoretical additive values of the two individual mutant perturbations combined. Means ± S.E. are given in supplemental Table S2.
