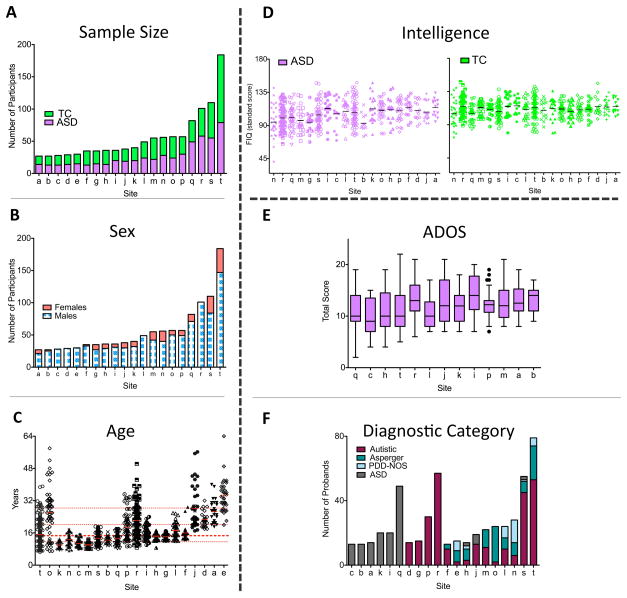
Figure 1. ABIDE Sample Characteristics.
(A) Total number of participants per group (green=Typical Controls [TC], purple=Autism Spectrum Disorders [ASD]) for each contributing site ordered as a function of sample size (labeled alphabetically, see Supplementary Table 2 for label key). The same site labels are used for Figures 1 B-F. (B) Number of males (blue-white) and females (red) for each site irrespective of diagnostic group (groups were matched for sex). (C) Age (in years) for all individuals per site (ordered by youngest age included per site) irrespective of diagnostic group (groups were age matched). Each site’s mean is represented as a solid red line; the median age across sites (14.7 years) is depicted with a thick red dashed line; 25th, 75th, and 90th percentiles (11.7, 20.1, and 28.3 years, respectively) are represented by thin red dashed lines. (D) Distribution of full IQ (FIQ) standard scores per site (ordered by lowest FIQ included per site) for individuals with ASD (purple, left plot) and TC (green, right plot), respectively. Solid black lines indicate mean FIQ per site. (E) The Tukey box-whiskers plots depict the distribution of Total Autism Diagnostic Observation Scale (ADOS) scores (i.e., sum of scaled Communication and Reciprocal Social interaction subtotals) for individuals with ASD in the 13 sites using the ADOS. (F) Number of probands assigned to specific ASD diagnostic categories per site. Categories were DSM-IV-TR Autistic Disorder (red), Asperger Syndrome (aqua green), and Pervasive Developmental Disorder—Not Otherwise Specified (PDD-NOS) (white-gray pattern), and individuals identified as ASD but not further differentiated into specific DSM-IV-TR subtypes (gray). Data displayed in D and E were imputed as described in main text.

