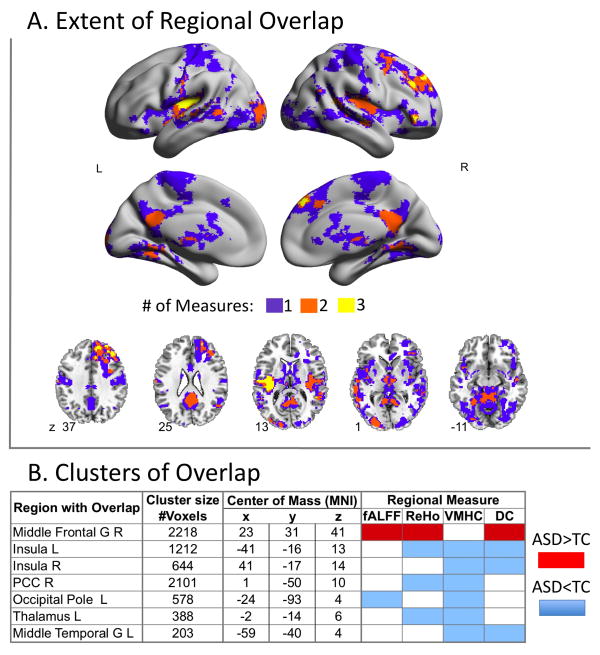
Figure 4. Overlap Between Regional Measures of Intrinsic Brain Function.
(A) Surface and axial maps depict the extent of overlap for significant group differences (i.e., Autism Spectrum Disorders [ASD] vs. Typical Controls [TC]) among any of the four regional measures of intrinsic brain function shown in Figure 3. Purple clusters represent areas of significant group differences emerging for only one measure; orange and yellow clusters indicate measures with overlap among 2 and 3 measures, respectively. (B) For each of the yellow and orange clusters in panel A, the table lists the cluster’s anatomical area label, cluster size in number of voxels, and stereotaxic coordinates for the center of mass in Montreal Neurological Institute (MNI) coordinates, the specific measures involved in the overlap, and the group difference direction (ASD>TC in red, ASD<TC in blue). L= Left hemisphere; R= Right hemisphere.

