
Figure 5. Seed Based Correlation Analyses: Default Network.
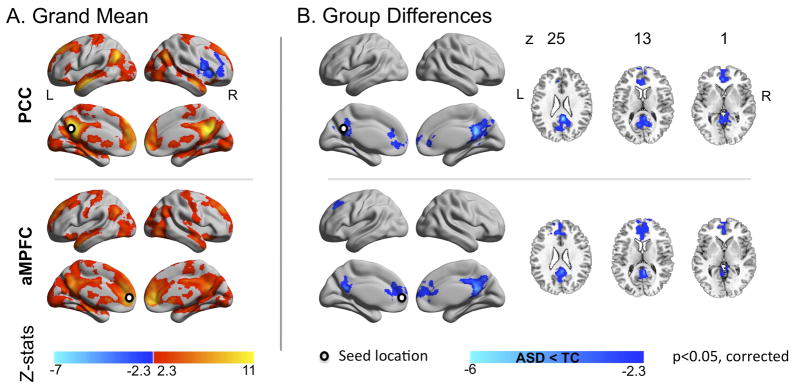
(A) Z maps of the grand means (i.e., across all 763 individuals) and (B) of the group differences between individuals with Autism Spectrum Disorders (ASD) and Typical Controls (TC) for the two midline core seed regions located in Posterior Cingulate Cortex (PCC) and Anterior Medial Prefrontal Cortex (aMPFC). Seeds were centered at Montreal Neurological Institute stereotaxic coordinates x=−8, y=−56, z=26 for PCC and x=−6, y=52, z=−2 for aMPFC, and are depicted as white dots on the surface maps. Gaussian random field theory was used to carry out cluster-level corrections for multiple comparisons (voxel-level Z>2.3; cluster significance: p<0.05, corrected). Significant clusters are overlaid on inflated surface maps generated using BrainNet Viewer (http://www.nitrc.org/projects/bnv/), as well as on axial images generated with REST Slice Viewer (http://www.restfmri.net). L= Left hemisphere; R= Right hemisphere.