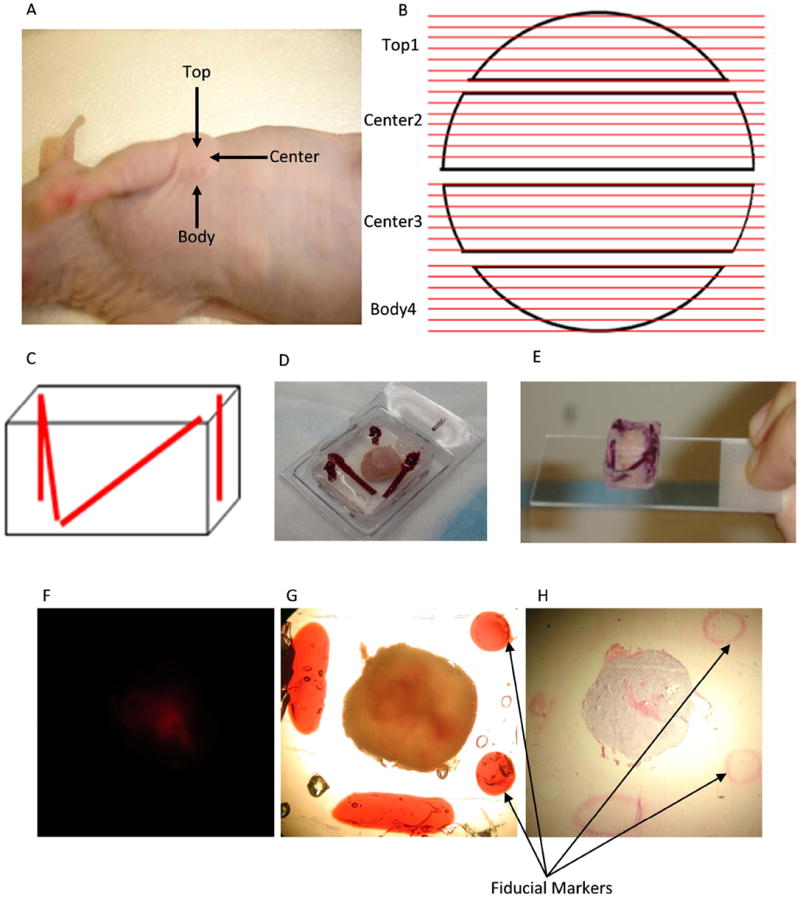
Figure 2.

A, Definition of a mouse breast tumor xenograft top, center and body portions; B, Diagram describing the sectioning of the tumor from top to body. Black objects: top 1st slice, center 2nd slice, center 3rd slice and body 4th slice. Red lines: Each 2-mm slice was sectioned into 5 – 10 μm cryosections and H&E stained. C, Diagram depicting 2 diagonal markers and 2 straight markers. D, Extracted tumor embedded in gelatin with 2 diagonal markers and 2 straight markers in the cryomold. E, Extracted tumor embedded in gelatin with markers after taking away the cryomold placed on microscope slide. F, Fluorescence microscopic image (1× objective) from 2-mm thick MDA-MB-231-HRE-tdTomato breast tumor tissue slice. G, Brightfield microscopic images (1× magnification ) of the same FOV from 2-mm thick MDA-MB-231-HRE-tdTomato breast tumor tissue slice with two straight circular shape and two diagonal elliptic shape fiducial markers. H, Corresponding microscopic H&E histology image (1× objective) from a 10-μm thick MDA-MB-231-HRE-tdTomato breast tumor tissue section with two straight circular shape and one diagonal elliptic shape fiducial markers.
