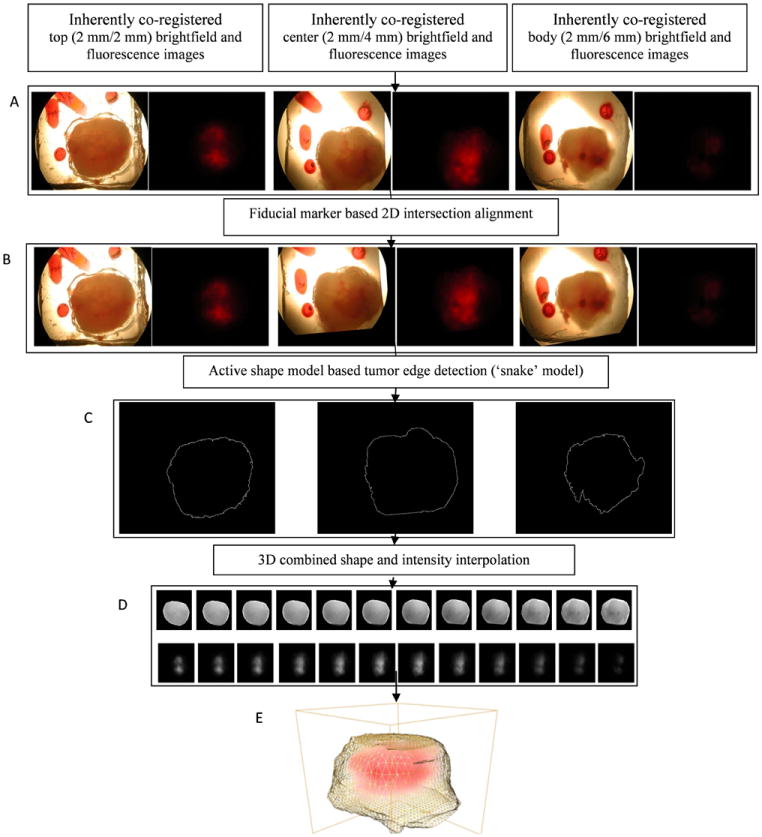
Figure 6.

Results of 3D reconstruction of optical brightfield and fluorescence images of 2-mm thick tumor slices. A, Original brightfield and fluorescence serial sections; B, Brightfield and fluorescence serial sections after fiducial marker based intersectional alignment; C, Detected edges of serial intersectionally aligned brightfield sections; D (top row), 3D combined shape and intensity interpolated brightfield images; D (bottom row), 3D intensity interpolated fluorescence images; E, 3D display of tumor boundary obtained from D (top row) and fluorescence intensities obtained from D (bottom row). Yellow grid: tumor boundary, red: fluorescence intensities.
