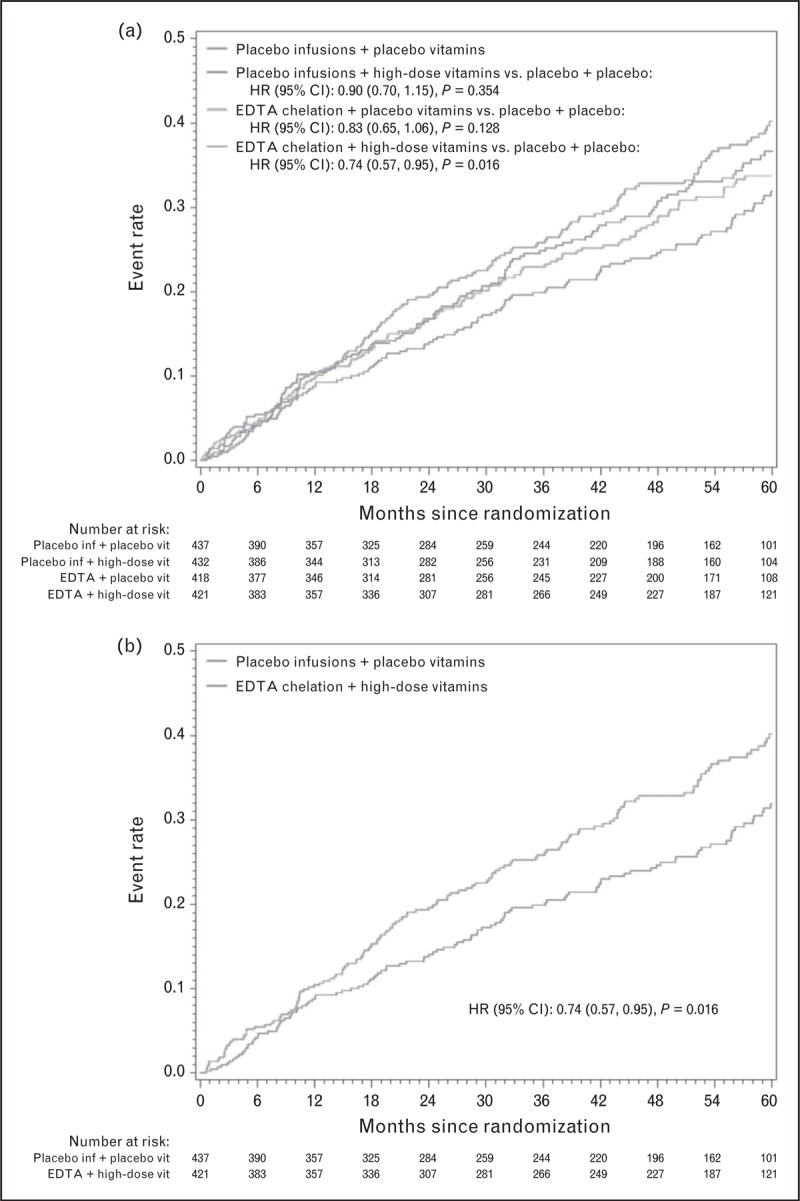
FIGURE 2.

The factorial group results of TACT – Kaplan–Meier estimates of the primary endpoint per group. (a) Kaplan–Meier curves (four factorial groups, primary endpoint); (b) Kaplan–Meier curves placebo/placebo vs. active/active (primary endpoint). Reproduced with permission [15▪].
