
Fig. 2.
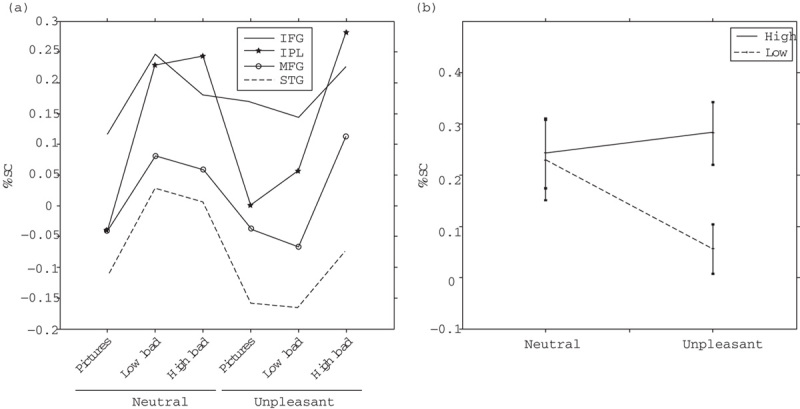
(a) Average values of percent signal change (%SC) in the different task conditions for the following regions of interest: right superior temporal gyrus (STG R); right inferior parietal lobe (IPL R); right inferior frontal gyrus (IFG R), and right middle frontal gyrus (MFG R). (b) %SC values of IPL R as in Fig. 2a are depicted for the conditions with targets and distractors.