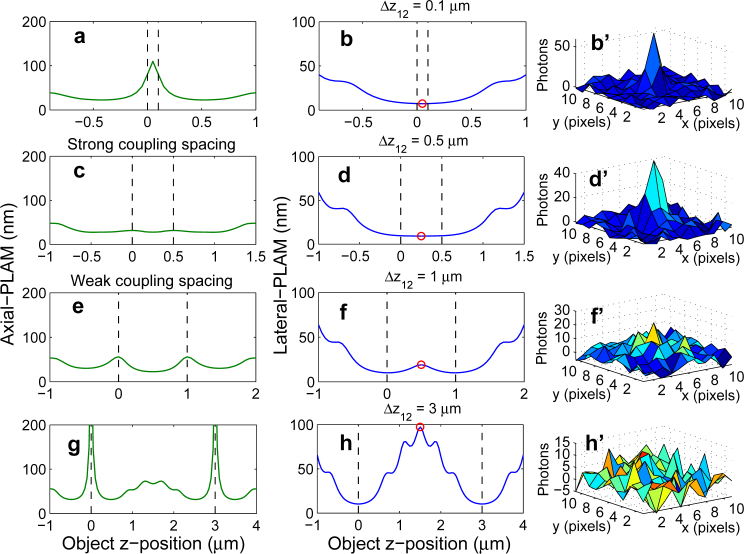
Fig. 3.
The behavior of the lateral-PLAM. The left and middle columns show the axial-PLAM and the lateral-PLAM, respectively, for a 2-plane MUM setup as a function of the z-position of the point source. The plane spacings (Δz12) are 0.1, 0.5, 1 and 3 μm from top to bottom. The right column shows the mesh plots of the simulated images of point sources located at z-positions shown by the red circles on the design plane. The simulation parameters are identical to those used in Fig. 2.

