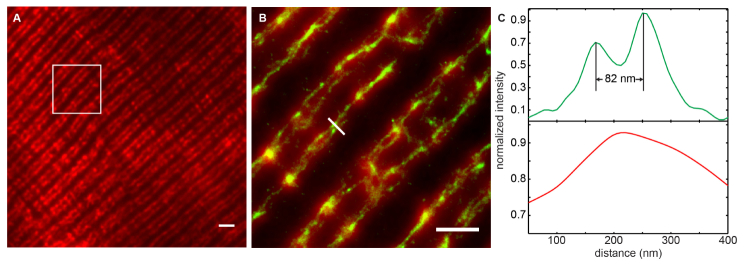
Fig. 7.

T-tubule structures in rat FDB fiber. (a) Epifluorescence image of MG29-labelled T-tubule network in rat skeletal muscle. Scale bar: 2 μm. (b) Overlay of the epifluorescence image (red) of the T-tubule and the corresponding superresolution image (green). Scale bar: 1 μm. (c). The line profiles of the selected region in (b). The green curve corresponds to the line profile from the superresolution image, which shows clearly the distance between the two T-tubule membranes is about 82 nm. The conventional epifluorescence image completely misses the fine structure (red curve).
