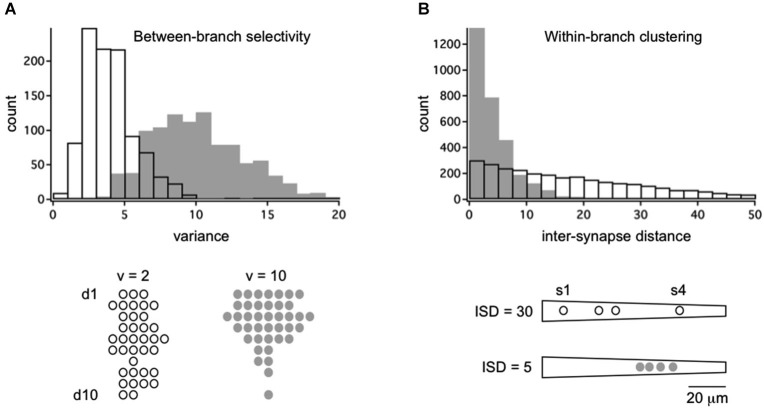
Figure 2.
Framework for the quantitative analysis of between-branch selectivity and within-branch clustering. (A) Distribution of 40 synapses across a population of 10 dendrites with random (open bars/symbols) or selective targeting (gray bars/symbols). Synapses were assigned to dendrites by independently sampling from evenly distributed noise (random) or a Gaussian distribution with SD = 4 (selective). Examples of outcomes are shown below for populations with dendrite-to-dendrite variance = 2 or 10. Symbols represent synapses for each of 10 dendrites, d1–d10. (B) Distribution of 4 synapses across a single dendrite with random (open bars/symbols) or selective targeting (gray bars/symbols) of dendritic address. Synapses were assigned to an address by independently sampling from evenly distributed noise (random) or a Gaussian distribution with SD = 10 (selective). Intersynapse distance (ISD) was measured along the dendritic path, yielding three ISDs per dendrite (total of 3000 ISDs). Example of outcomes are shown below for dendrites with mean ISD = 30 or 5. Symbols represent dendritic address.

